

Question: Question 1: Price Quantity Demanded Quantity Supplied 0.00 1350 0 5.00 1200 300 10.00 1050 600 15.00 900 900 20.00 750 1200 25.00 600 1500
Question 1:
Price
Quantity Demanded
Quantity Supplied
0.00
1350
0
5.00
1200
300
10.00
1050
600
15.00
900
900
20.00
750
1200
25.00
600
1500
30.00
450
1800
35.00
300
2100
a)Thetable shows thedemand and supply schedules fortuna sashimi (sushi). Plot bothDemand and Supplyon a piece of paperand attach it as a photo to thisdocument.Labeleverythingthat'srelevant andfindthe equilibrium price and quantity.
b)Calculate the consumer surplus, producer surplus, and total surplusat the market equilibrium.
c)Now suppose the mayor of Vancouver (who loves sushi) thinks the equilibrium market price of tuna sashimi is too high.Brieflydescribehow the mayor can use price controls to change the price so he is happy.Show this in the graphin part (a).
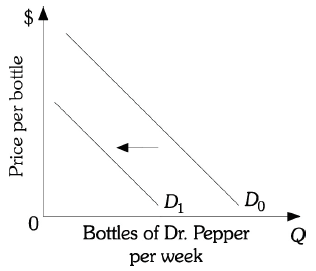
Question 2:The graphbelow(on theleft)shows two demand curves for Dr. Pepper soda. D0is the original curve and D1is the new curve.Describe2reasons that can explain the demand curve shift.
Graph for Question 2
Step by Step Solution
There are 3 Steps involved in it

Get step-by-step solutions from verified subject matter experts