

Question: Question 1: Question 2: Please show work - Thank you! TipTop Flight School offers flying lessons at a small municipal airport. The school's owner and
Question 1:
Question 2:
 Please show work - Thank you!
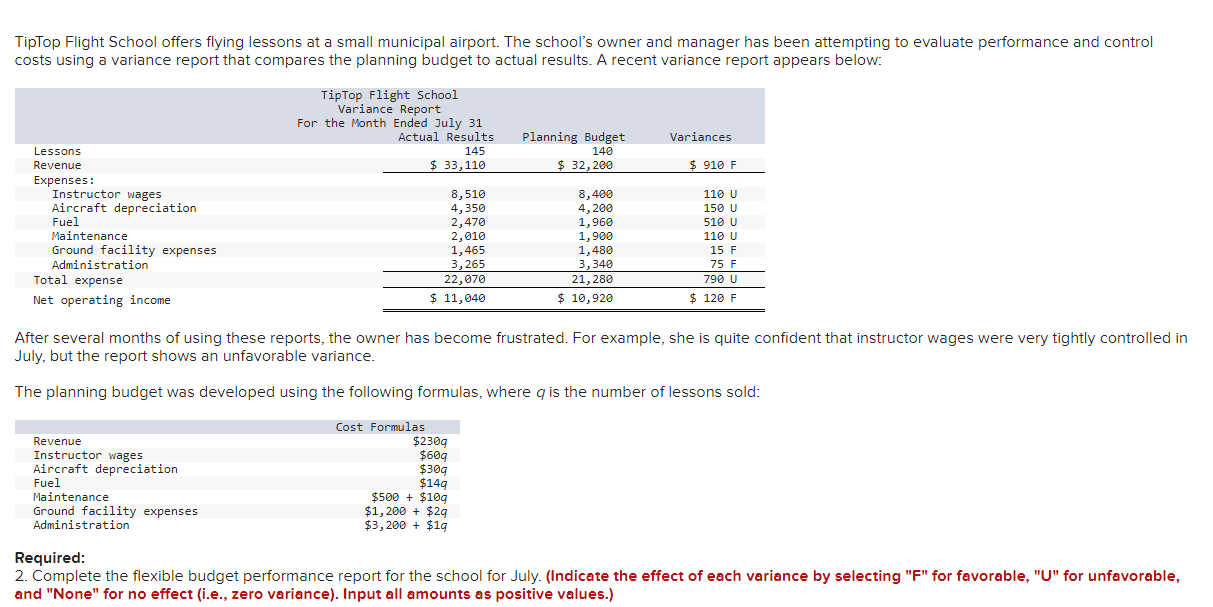
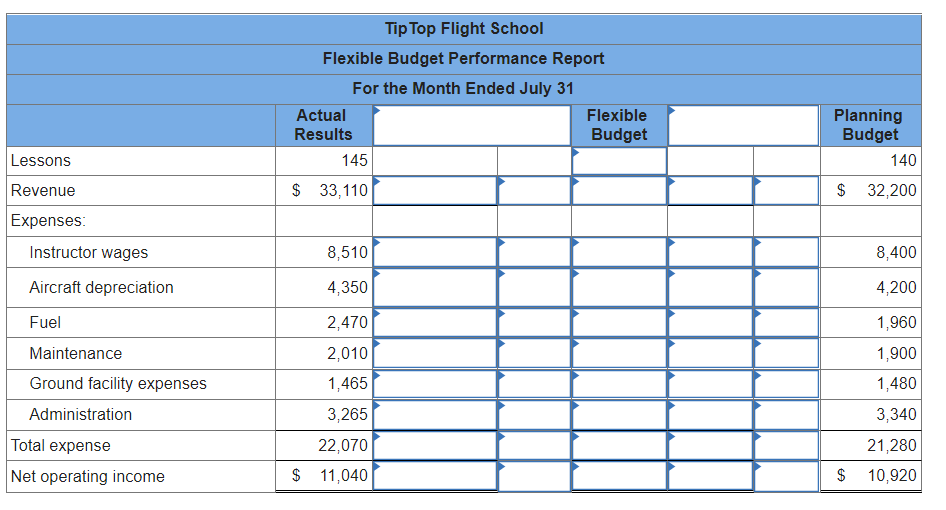
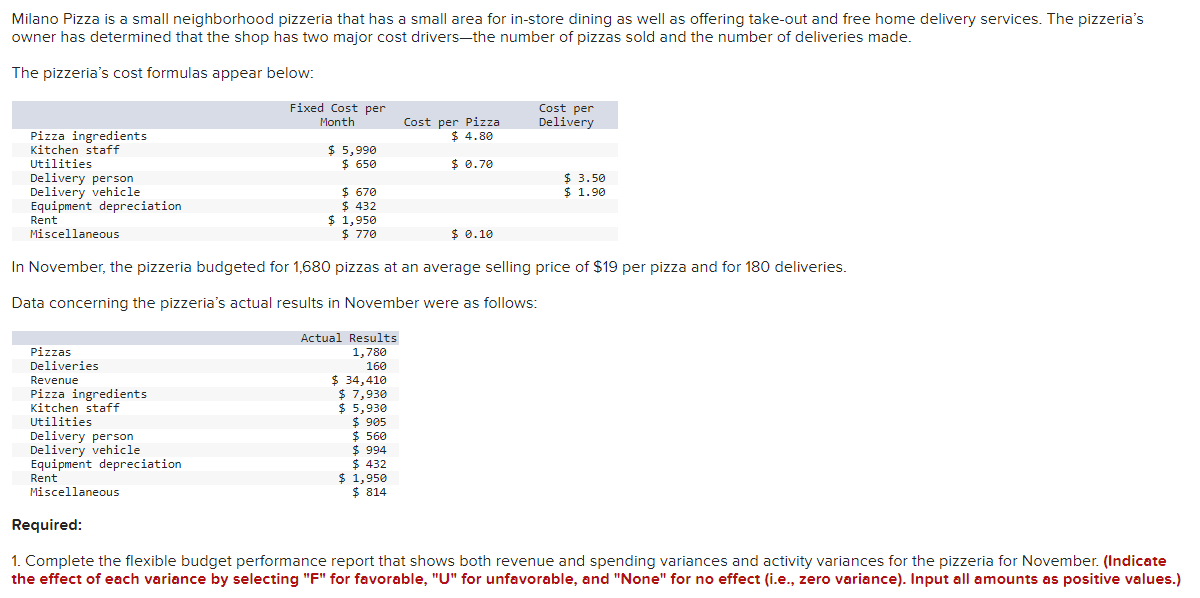
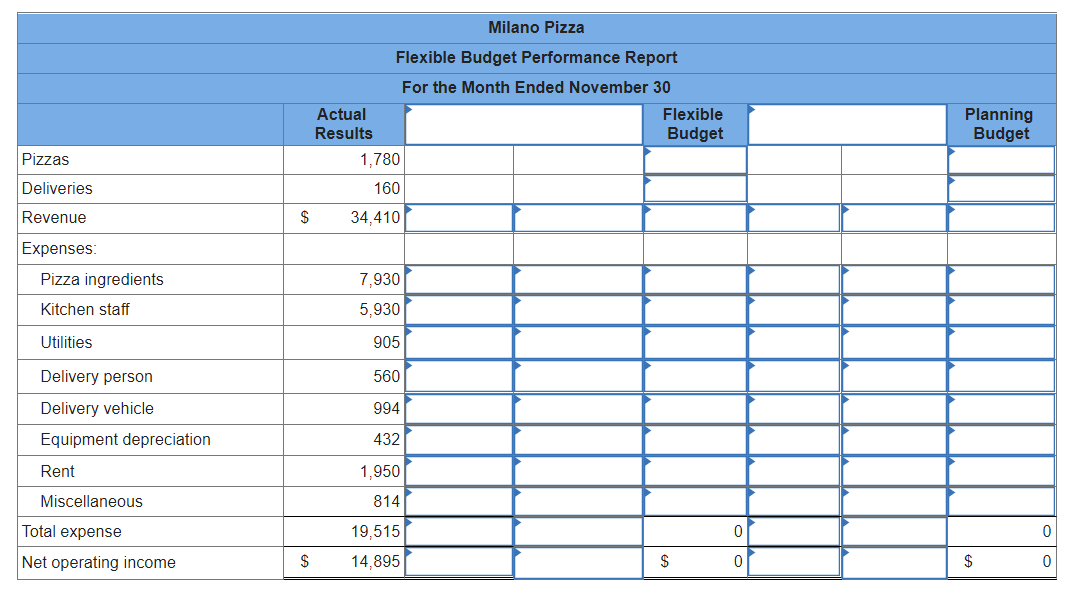
TipTop Flight School offers flying lessons at a small municipal airport. The school's owner and manager has been attempting to evaluate performance and control costs using a variance report that compares the planning budget to actual results. A recent variance report appears below: TipTop Flight School Variance Report For the Month Ended July 31 Actual Results 145 $ 33,110 Variances Planning Budget 140 $ 32,200 $ 910 F 110 U 150 U Lessons Revenue Expenses: Instructor wages Aircraft depreciation Fuel Maintenance Ground facility expenses Administration Total expense Net operating income 8,510 4,350 2,47 2,010 1,465 3,265 22,070 $ 11,040 8,400 4,200 1,960 1,900 1,480 3,340 21, 280 $ 10,920 510 U 110 U 15 F 75 F 790 U $ 120 F After several months of using these reports, the owner has become frustrated. For example, she is quite confident that instructor wages were very tightly controlled in July, but the report shows an unfavorable variance. The planning budget was developed using the following formulas, where q is the number of lessons sold: Cost Formulas $2309 $609 Revenue Instructor wages Aircraft depreciation Fuel Maintenance Ground facility expenses Administration $309 $149 $500 + $109 $1,200 + $29 $3,200 + $19 Required: 2. Complete the flexible budget performance report for the school for July. (Indicate the effect of each variance by selecting "F" for favorable, "U" for unfavorable, and "None" for no effect (i.e., zero variance). Input all amounts as positive values.) Tip Top Flight School Flexible Budget Performance Report For the Month Ended July 31 Actual Flexible Results Budget 145 Planning Budget 140 $ 33,110 $ 32,200 Lessons Revenue Expenses Instructor wages Aircraft depreciation 8,510 8,400 4,350 4,200 1,960 Fuel Maintenance Ground facility expenses Administration 2,470 2,010 1,465 3,265 22,070 $ 11,040 1,900 1,480 3,340 21,280 $ 10,920 Total expense Net operating income Milano Pizza is a small neighborhood pizzeria that has a small area for in-store dining as well as offering take-out and free home delivery services. The pizzeria's owner has determined that the shop has two major cost driversthe number of pizzas sold and the number of deliveries made. The pizzeria's cost formulas appear below: Fixed Cost per Month Cost per Delivery Cost per Pizza $ 4.80 $ 5,990 $ 650 $ 0.70 Pizza ingredients Kitchen staff Utilities Delivery person Delivery vehicle Equipment depreciation Rent Miscellaneous $ 3.50 $ 1.90 $ 670 $ 432 $ 1,950 $ 770 $ 0.10 In November, the pizzeria budgeted for 1,680 pizzas at an average selling price of $19 per pizza and for 180 deliveries. Data concerning the pizzeria's actual results in November were as follows: Pizzas Deliveries Revenue Pizza ingredients Kitchen staff Utilities Delivery person Delivery vehicle Equipment depreciation Rent Miscellaneous Actual Results 1,780 160 $ 34,410 $ 7,930 $ 5,930 $ 905 $ 560 $ 994 $ 432 $ 1,950 $ 814 Required: 1. Complete the flexible budget performance report that shows both revenue and spending variances and activity variances for the pizzeria for November. (Indicate the effect of each variance by selecting "F" for favorable, "U" for unfavorable, and "None" for no effect (i.e., zero variance). Input all amounts as positive values.) Milano Pizza Flexible Budget Performance Report For the Month Ended November 30 Actual Flexible Results Budget 1.780 Planning Budget Pizzas Deliveries 160 Revenue $ 34,410 Expenses Pizza ingredients Kitchen staff 7,930 5,930 Utilities 905 560 Delivery person Delivery vehicle Equipment depreciation 994 432 Rent 1,950 Miscellaneous 814 Total expense 19,515 0 0 Net operating income $ 14,895 $ 0 $ 0
Step by Step Solution
There are 3 Steps involved in it

Get step-by-step solutions from verified subject matter experts