

Question: QUESTION 1) QUESTION 2) PLEASE USE PYTHON. THANK YOU. I WILL RATE. #All packages needed import numpy as np import scipy.special as spsp import scipy.stats
QUESTION 1)

QUESTION 2)
PLEASE USE PYTHON. THANK YOU. I WILL RATE.
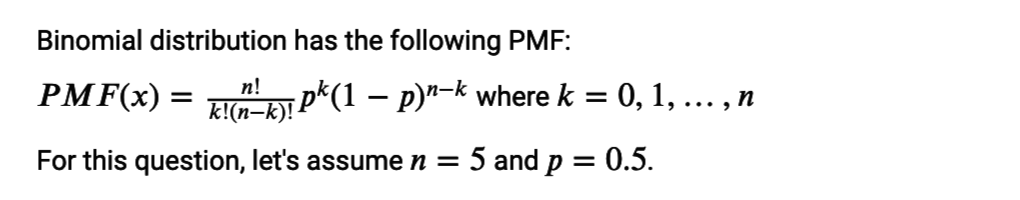
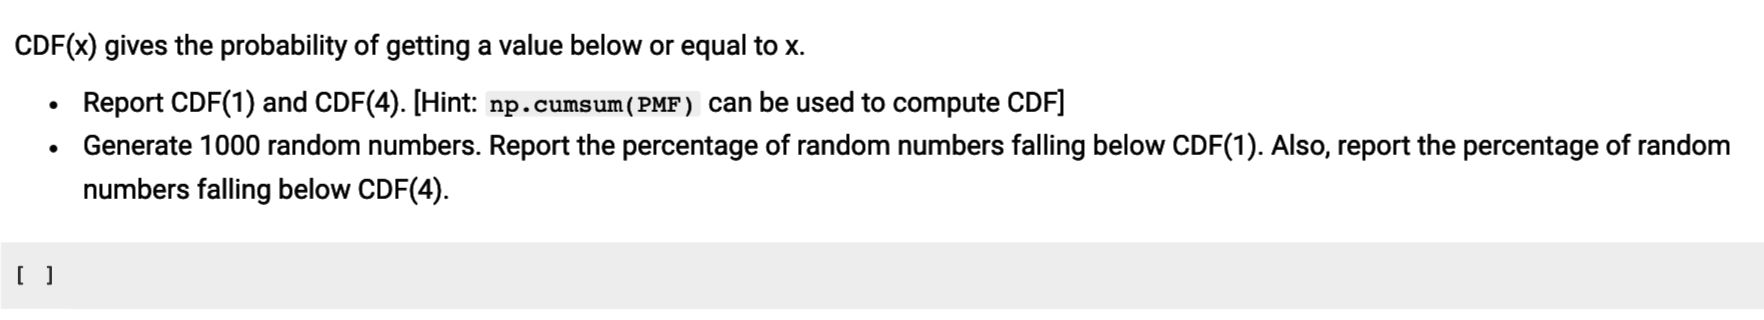
#All packages needed import numpy as np import scipy.special as spsp import scipy.stats as spspt import matplotlib.pyplot as plt &matplotlib inline Binomial distribution has the following PMF: PM F(x) = tiimivo pk(1 p)n-k where k = 0, 1, ...,n For this question, let's assume n= 5 and p = 0.5. Visualize this distribution using a bar chart. CDF(x) gives the probability of getting a value below or equal to x. Report CDF(1) and CDF(4). (Hint: np.cumsum (PMF) can be used to compute CDF] Generate 1000 random numbers. Report the percentage of random numbers falling below CDF(1). Also, report the percentage of random numbers falling below CDF(4)
Step by Step Solution
There are 3 Steps involved in it

Get step-by-step solutions from verified subject matter experts