

Question: QUESTION 1: QUESTION 2: QUESTION 3: QUESTION 4: Mary Beth Marrs, the manager of an apartment complex, feels overwhelmed by the number of complaints she
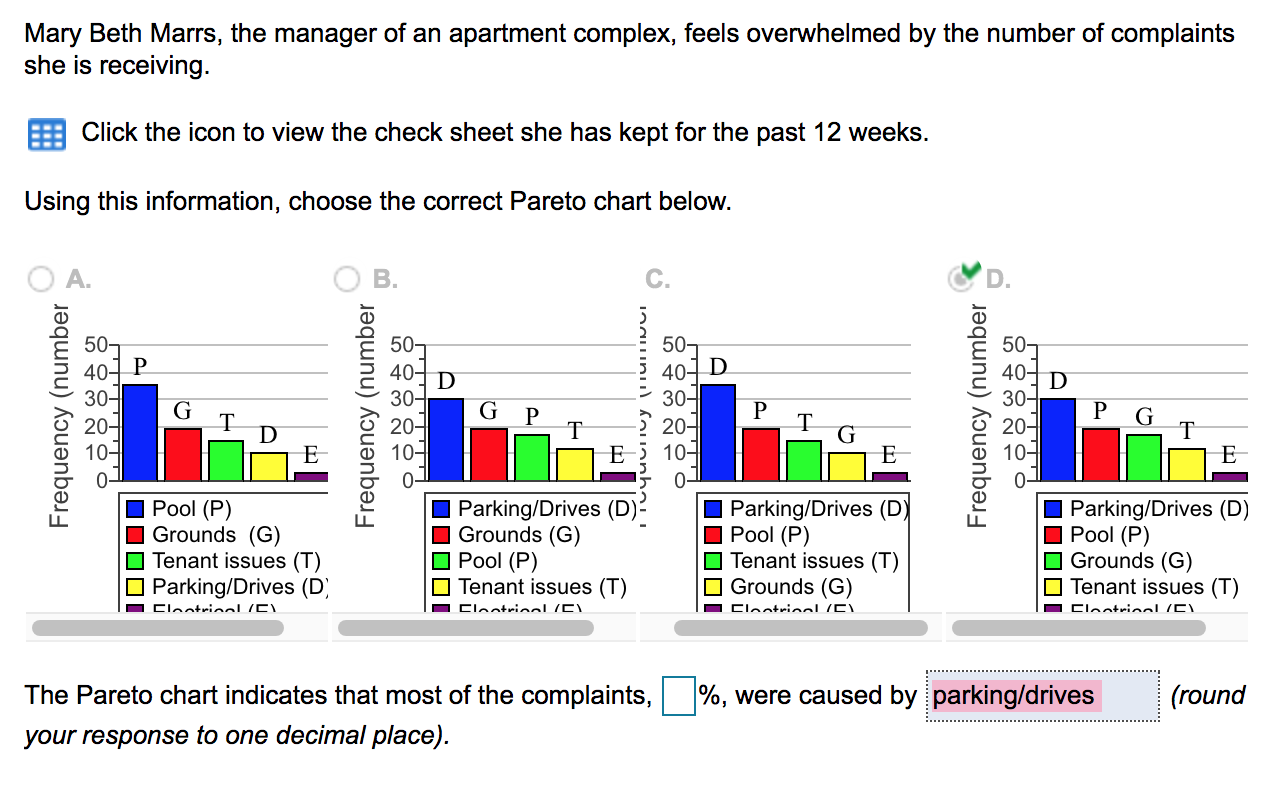
QUESTION 1:
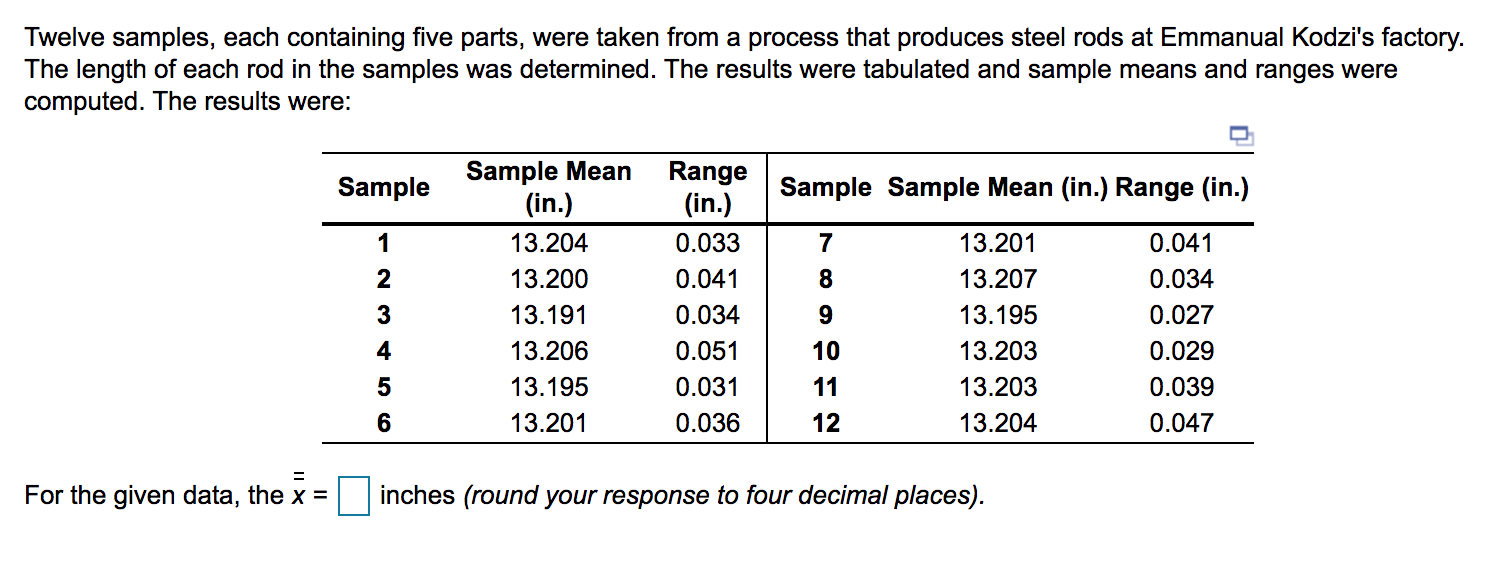
QUESTION 2:
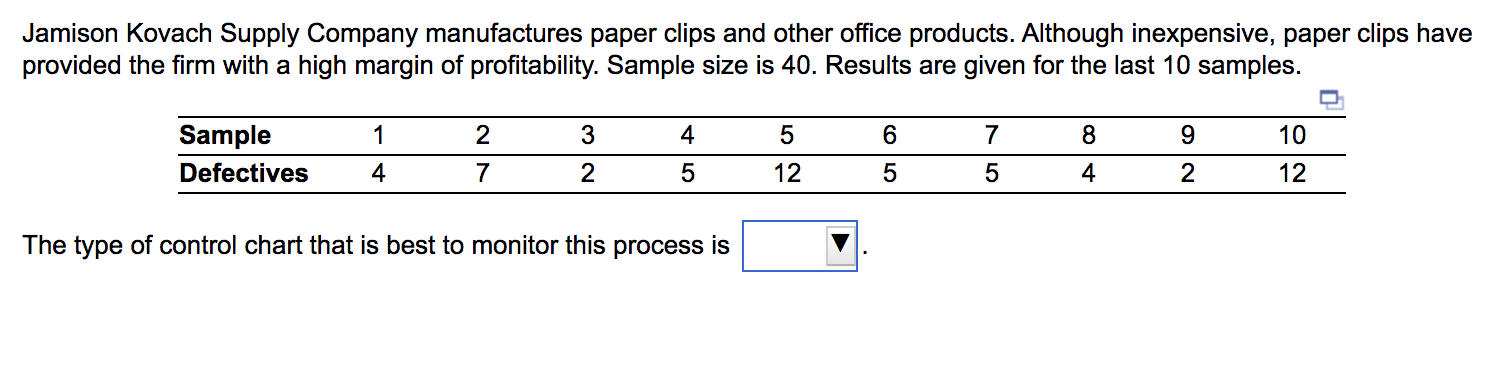
 QUESTION 3:
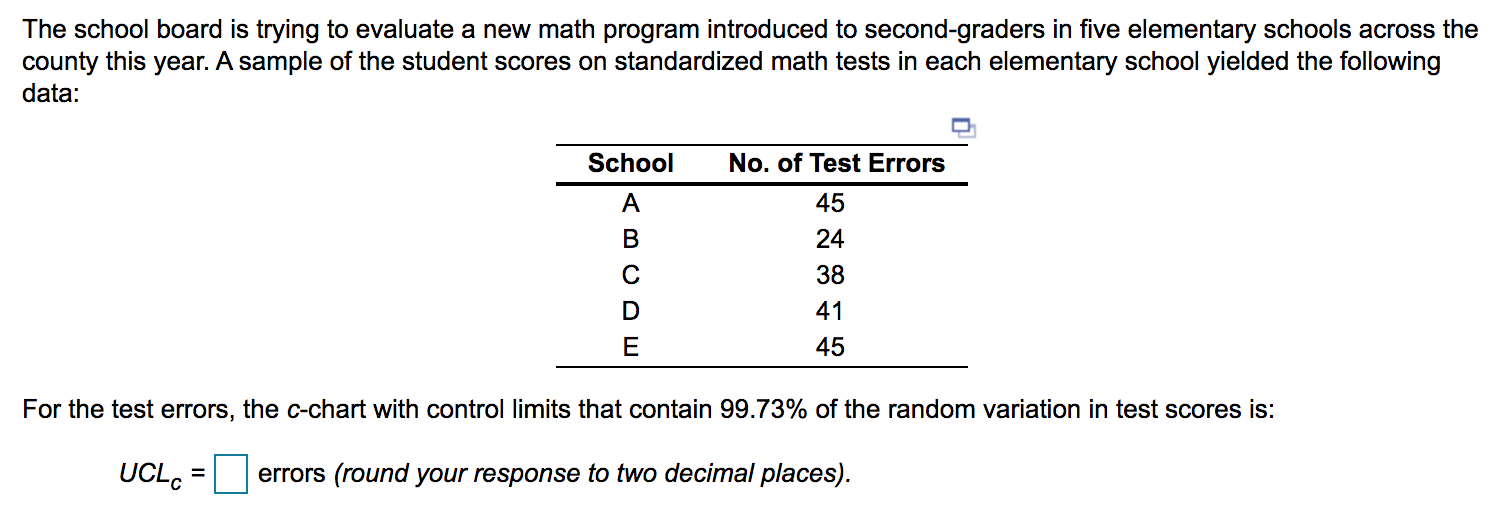
QUESTION 4:
Step by Step Solution
There are 3 Steps involved in it
1 Expert Approved Answer
Step: 1 Unlock

Question Has Been Solved by an Expert!
Get step-by-step solutions from verified subject matter experts
Step: 2 Unlock
Step: 3 Unlock