Question: question #1 Question #2 Question #3 What conclusion would you reach concerning whether the following process is in control or not? 187 16- 14- 12-
question #1
Question #2
Question #3
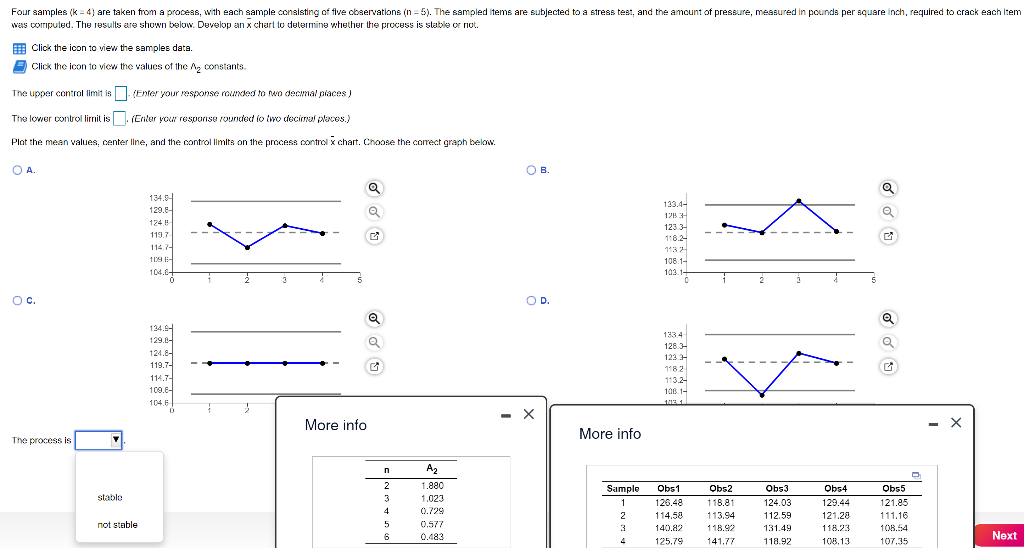
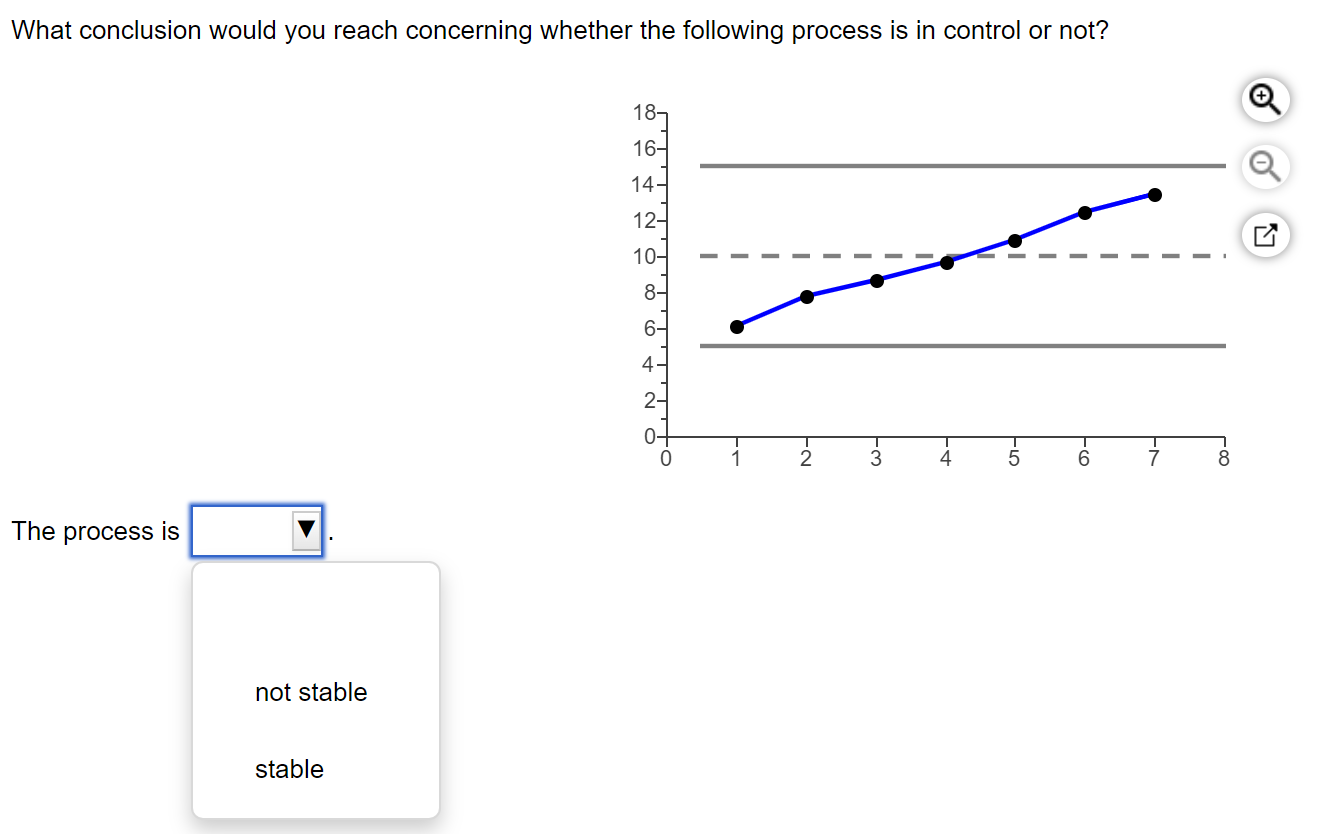
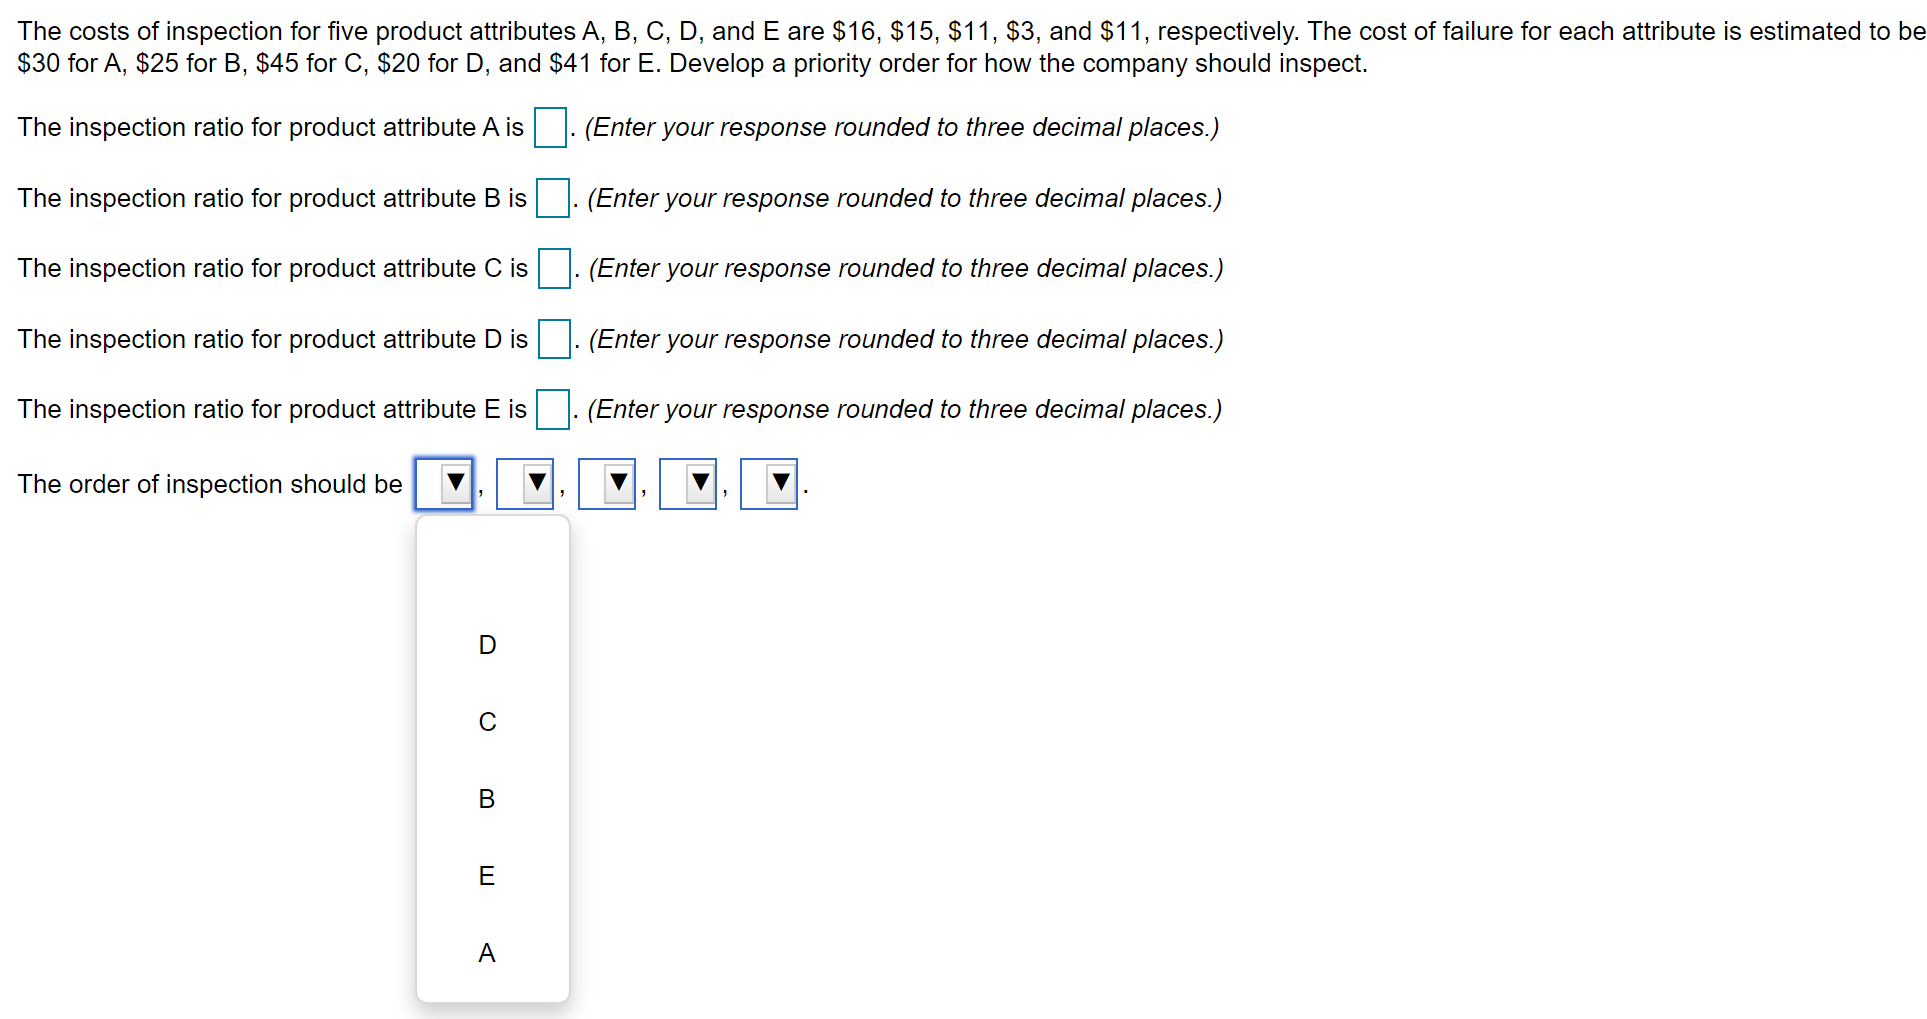
What conclusion would you reach concerning whether the following process is in control or not? 187 16- 14- 12- 10- 8- 4 2- - 1 1 2 FL 3 4 6 03- 7 8 The process is not stable stable The costs of inspection for five product attributes A, B, C, D, and E are $16, $15, $11, $3, and $11, respectively. The cost of failure for each attribute is estimated to be $30 for A, $25 for B, $45 for C, $20 for D, and $41 for E. Develop a priority order for how the company should inspect. The inspection ratio for product attribute A is - (Enter your response rounded to three decimal places.) The inspection ratio for product attribute B is (Enter your response rounded to three decimal places.) The inspection ratio for product attribute C is (Enter your response rounded to three decimal places.) The inspection ratio for product attribute D is (Enter your response rounded to three decimal places.) The inspection ratio for product attribute E is 1. (Enter your response rounded to three decimal places.) The order of inspection should be D B E A Four Samples (k =4) are taken from a process, with each sample consisting of five observations (n=5). The sampled items are subjected to a stress test, and the amount of pressure, measured in pounds per square inch, required to crack each item was computed. The results are shown below. Develop an xcher to determine whether the process is stable or not. Click the icon to view the samples data. Click the icon to view the values of the An constants. The upper controllimit is (Enter your response rounded to no decimal places) wo ) The lower controllimit is. (Enter your response rounded lo lo decimal places.) Plot the mean values, center line, and the control limits on the process control chart. Choose the correct graph below. OA OB. Q 134.041 129.8 124 119.7 114.7- 109.6 104.6+ 123.4- 123- 1233- 118.2- 1932 108.1- 103.14 5 5 Oc. OD a 134.44 129.6- 124.8- 119.7 114.7- 109.6- 104.5 133.4 128 - 123 1982 113.2- 108.1- More info More info The process is n 2 Sample stable 3 A2 1.880 1.023 0.729 0.577 0.483 1 2 Obs1 126.48 114.53 140.82 125.79 4 5 6 Obs2 118.81 113.94 118.92 141.77 Obs3 124.03 112.59 131.49 118.92 Obs4 129.44 121.28 118.23 108.13 Obs5 121.85 111.16 108.54 107.35 not stable 3 Next What conclusion would you reach concerning whether the following process is in control or not? 187 16- 14- 12- 10- 8- 4 2- - 1 1 2 FL 3 4 6 03- 7 8 The process is not stable stable The costs of inspection for five product attributes A, B, C, D, and E are $16, $15, $11, $3, and $11, respectively. The cost of failure for each attribute is estimated to be $30 for A, $25 for B, $45 for C, $20 for D, and $41 for E. Develop a priority order for how the company should inspect. The inspection ratio for product attribute A is - (Enter your response rounded to three decimal places.) The inspection ratio for product attribute B is (Enter your response rounded to three decimal places.) The inspection ratio for product attribute C is (Enter your response rounded to three decimal places.) The inspection ratio for product attribute D is (Enter your response rounded to three decimal places.) The inspection ratio for product attribute E is 1. (Enter your response rounded to three decimal places.) The order of inspection should be D B E A Four Samples (k =4) are taken from a process, with each sample consisting of five observations (n=5). The sampled items are subjected to a stress test, and the amount of pressure, measured in pounds per square inch, required to crack each item was computed. The results are shown below. Develop an xcher to determine whether the process is stable or not. Click the icon to view the samples data. Click the icon to view the values of the An constants. The upper controllimit is (Enter your response rounded to no decimal places) wo ) The lower controllimit is. (Enter your response rounded lo lo decimal places.) Plot the mean values, center line, and the control limits on the process control chart. Choose the correct graph below. OA OB. Q 134.041 129.8 124 119.7 114.7- 109.6 104.6+ 123.4- 123- 1233- 118.2- 1932 108.1- 103.14 5 5 Oc. OD a 134.44 129.6- 124.8- 119.7 114.7- 109.6- 104.5 133.4 128 - 123 1982 113.2- 108.1- More info More info The process is n 2 Sample stable 3 A2 1.880 1.023 0.729 0.577 0.483 1 2 Obs1 126.48 114.53 140.82 125.79 4 5 6 Obs2 118.81 113.94 118.92 141.77 Obs3 124.03 112.59 131.49 118.92 Obs4 129.44 121.28 118.23 108.13 Obs5 121.85 111.16 108.54 107.35 not stable 3 Next


