

Question: Question 1 Select the two ways the plot above displays data in a poor or incorrect manner. Axes increments are too large. Units are incorrect
Question
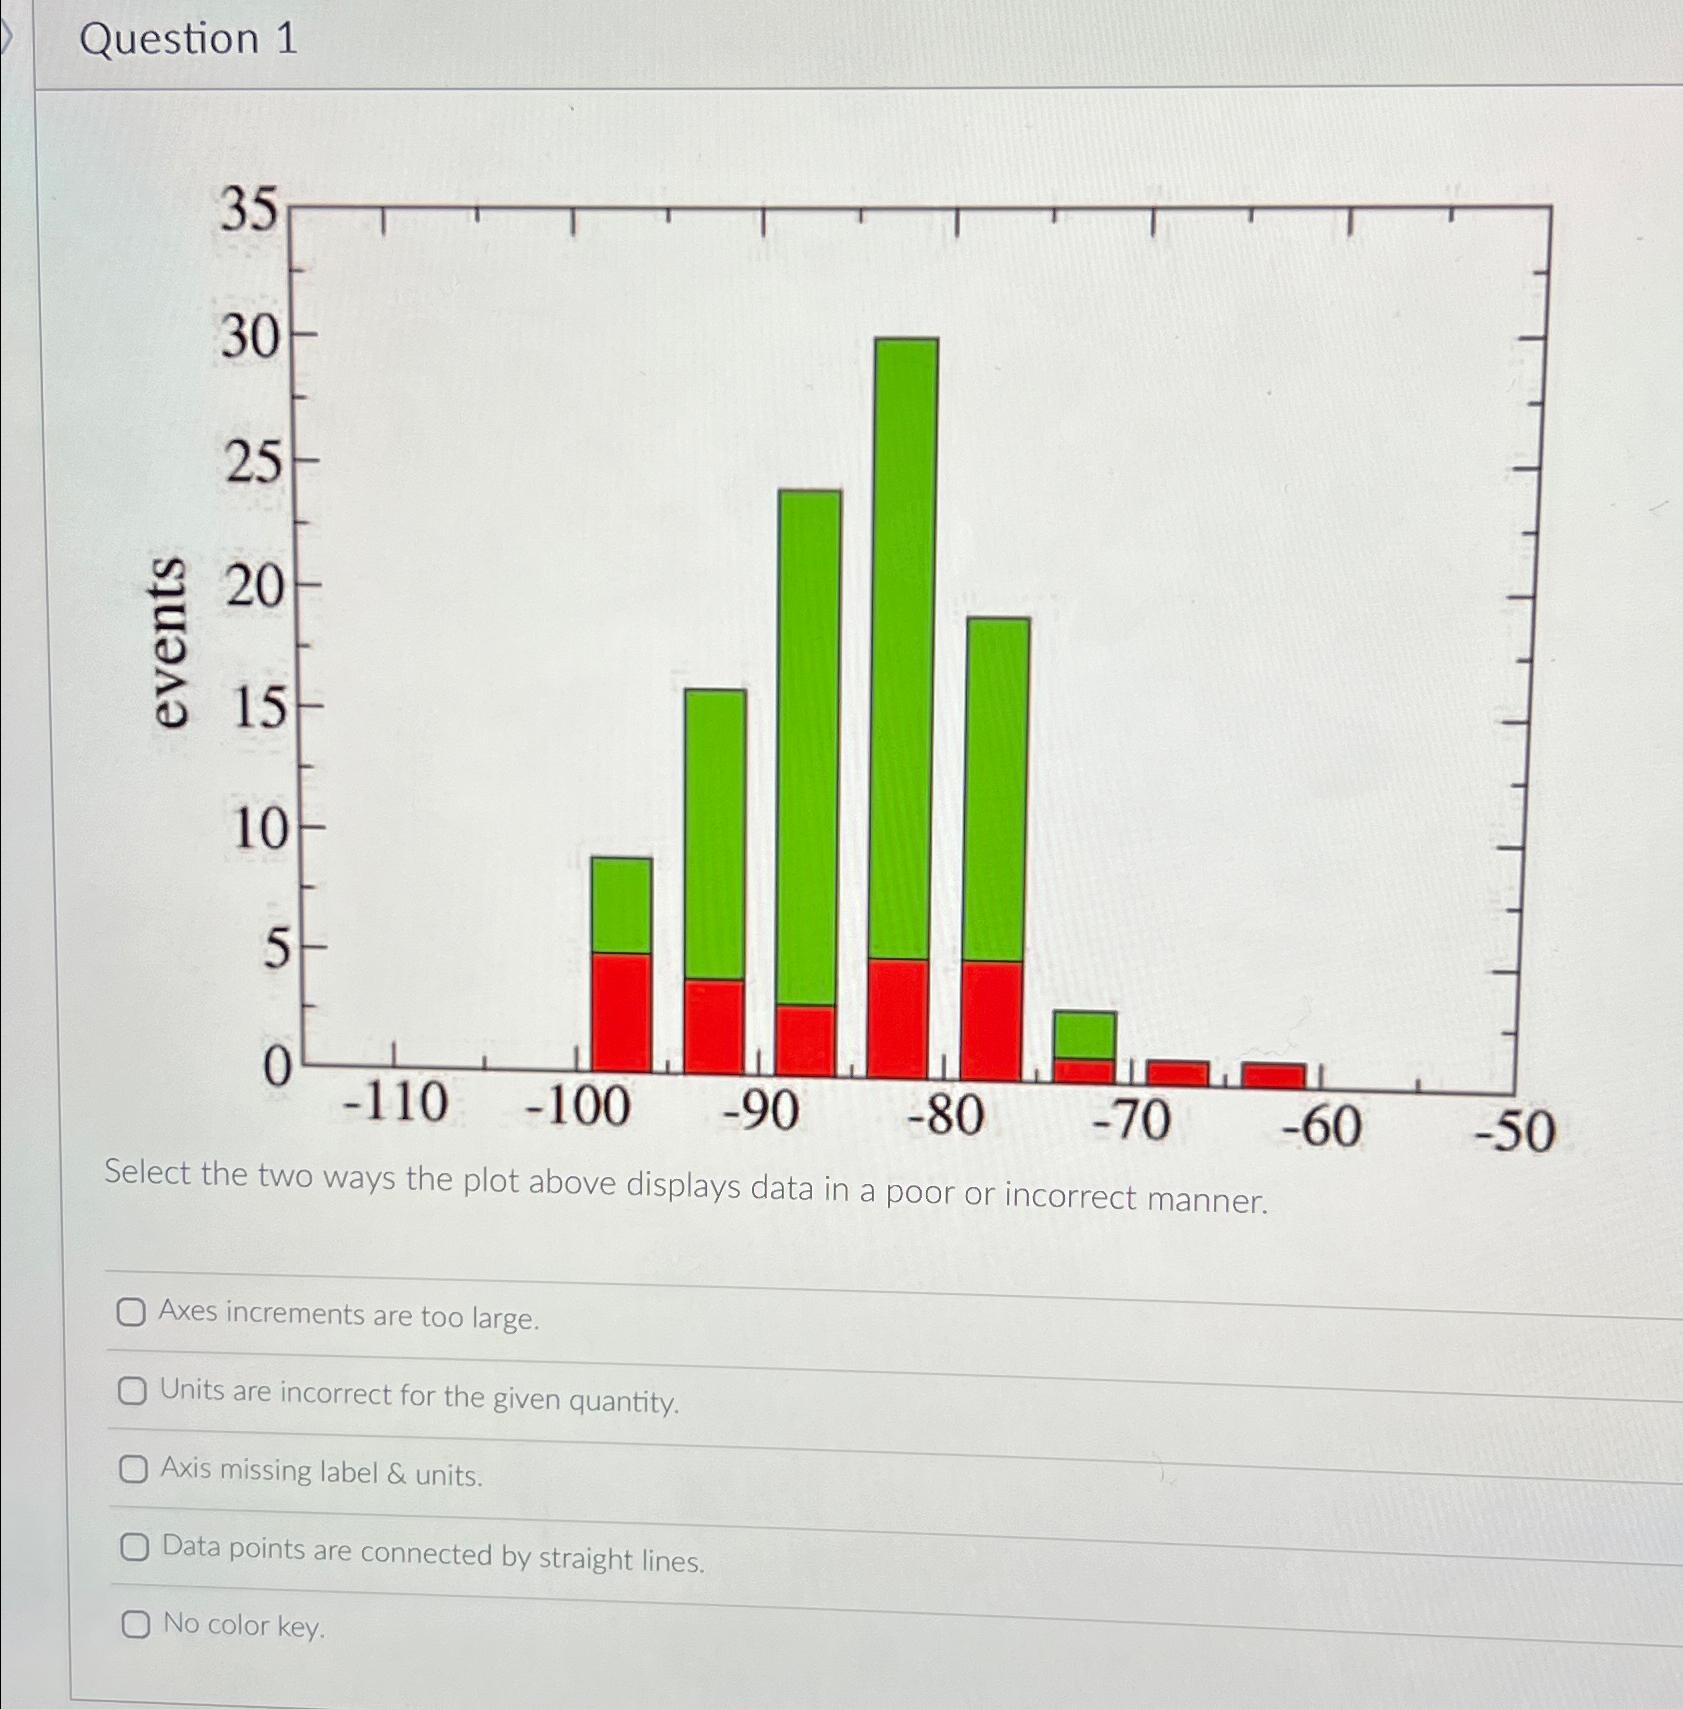
Select the two ways the plot above displays data in a poor or incorrect manner.
Axes increments are too large.
Units are incorrect for the given quantity.
Axis missing label & units.
Data points are connected by straight lines.
No color key.
Step by Step Solution
There are 3 Steps involved in it
1 Expert Approved Answer
Step: 1 Unlock

Question Has Been Solved by an Expert!
Get step-by-step solutions from verified subject matter experts
Step: 2 Unlock
Step: 3 Unlock