

Question: Question 1 Simulating the following AR(1) process using Python or R . Simulate the AR(1) process with -0, Xi ~ N(0,1),Y0 ~ N(0,1) and with
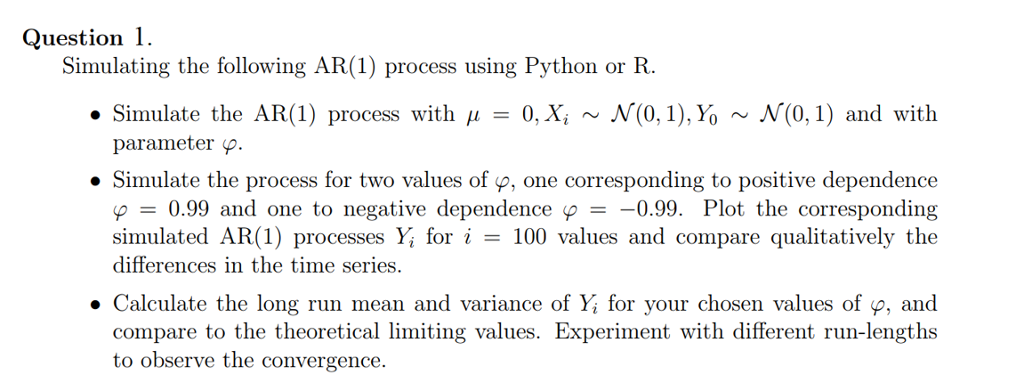
Question 1 Simulating the following AR(1) process using Python or R . Simulate the AR(1) process with -0, Xi ~ N(0,1),Y0 ~ N(0,1) and with para meter Simulate the process for two values of p, one corresponding to positive dependence -0.99 and one to negative dependence -_0.99. Plot the corresponding simulated AR(1) processes Y for100 values and compare qualitatively the differences in the time series. . Calculate the long run mean and variance of Y, for your chosen values of p, and compare to the theoretical limiting values. Experiment with different run-lengths to observe the convergence. Question 1 Simulating the following AR(1) process using Python or R . Simulate the AR(1) process with -0, Xi ~ N(0,1),Y0 ~ N(0,1) and with para meter Simulate the process for two values of p, one corresponding to positive dependence -0.99 and one to negative dependence -_0.99. Plot the corresponding simulated AR(1) processes Y for100 values and compare qualitatively the differences in the time series. . Calculate the long run mean and variance of Y, for your chosen values of p, and compare to the theoretical limiting values. Experiment with different run-lengths to observe the convergence
Step by Step Solution
There are 3 Steps involved in it

Get step-by-step solutions from verified subject matter experts