

Question: Question 1: Stock market Rate and Return . ( 2 marks each, total 18 marks) Instructions: 1) You must complete the assignment individually. Any collusion
Question 1: Stock market Rate and Return. (2 marks each, total 18 marks)
Instructions:
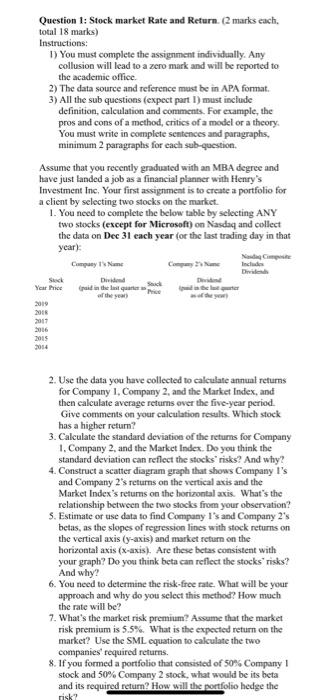
Assume that you recently graduated with an MBA degree and have just landed a job as a financial planner with Henrys Investment Inc. Your first assignment is to create a portfolio for a client by selecting two stocks on the market.
| Company 1s Name | Company 2s Name | Nasdaq Composite Includes Dividends | ||
Year | Stock Price
| Dividend (paid in the last quarter as of the year) | Stock Price | Dividend (paid in the last quarter as of the year) |
|
2019 |
|
|
|
|
|
2018 |
|
|
|
|
|
2017 |
|
|
|
|
|
2016 |
|
|
|
|
|
2015 |
|
|
|
|
|
2014 |
|
|
|
|
|
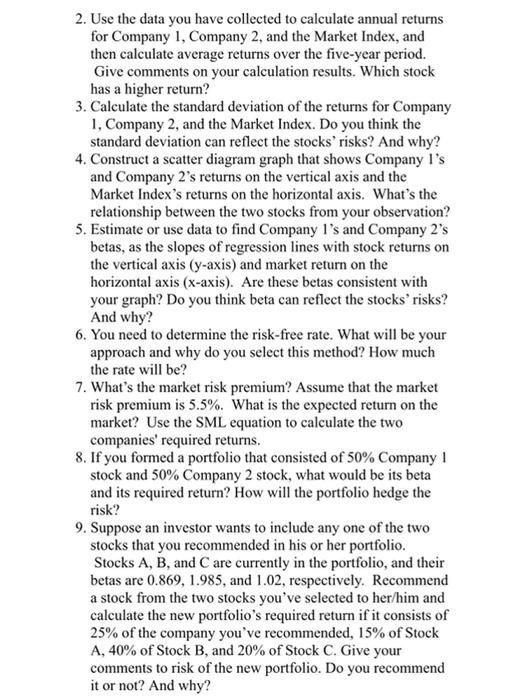
Question 1: Stock market Rate and Return. (2 marks each, total 18 marks) Instructions: D) You must complete the assignment individually. Any collusion will lead to a zero mark and will be reported to the academic office 2) The data source and reference must be in APA format. 3) All the sub questions (expect part 1) must include definition, calculation and comments. For example, the pros and cons of a method, critics of a model or a theory You must write in complete sentences and paragraphs, minimum 2 paragraphs for each sub-question Assume that you recently graduated with an MBA degree and have just landed a job as a financial planner with Henry's Investment Inc, Your first assignment is to create a portfolio for a client by selecting two stocks on the market 1. You need to complete the below table by selecting ANY two stocks (except for Microsoft) on Nasdaq and collect the data on Dec 31 each year (or the last trading day in that year) Company Name puis en Year 2019 2011 2015 2. Use the data you have collected to calculate annual returns for Company 1. Company 2, and the Market Index, and then calculate average returns over the five-year period Give comments on your calculation results. Which stock has a higher return? 3. Calculate the standard deviation of the returns for Company 1. Company 2, and the Market Index. Do you think the standard deviation can reflect the stocks risks? And why? 4. Construct a scatter diagram graph that shows Company I's and Company 2's returns on the vertical axis and the Market Index's returns on the horizontal axis What's the relationship between the two stocks from your observation? 5. Estimate or use data to find Company I's and Company 2's betas, as the slopes of regression lines with stock returns on the vertical axis (y-axis) and market return on the horizontal axis (x-axis). Are these betas consistent with your graph? Do you think beta can reflect the stocks' risks? And why? 6. You need to determine the risk-free rate. What will be your approach and why do you select this method? How much the rate will be? 7. What's the market risk premium? Assume that the market risk premium is 5.5%. What is the expected return on the market? Use the SML equation to calculate the two companies' required returns 8. If you formed a portfolio that consisted of 50% Company stock and 50% Company 2 stock, what would be its beta and its required return? How will the portfolio hedge the risk? 2. Use the data you have collected to calculate annual returns for Company 1, Company 2, and the Market Index, and then calculate average returns over the five-year period. Give comments on your calculation results. Which stock has a higher return? 3. Calculate the standard deviation of the returns for Company 1, Company 2, and the Market Index. Do you think the standard deviation can reflect the stocks' risks? And why? 4. Construct a scatter diagram graph that shows Company I's and Company 2's returns on the vertical axis and the Market Index's returns on the horizontal axis. What's the relationship between the two stocks from your observation? 5. Estimate or use data to find Company I's and Company 2's betas, as the slopes of regression lines with stock returns on the vertical axis (y-axis) and market return on the horizontal axis (x-axis). Are these betas consistent with your graph? Do you think beta can reflect the stocks' risks? And why? 6. You need to determine the risk-free rate. What will be your approach and why do you select this method? How much the rate will be? 7. What's the market risk premium? Assume that the market risk premium is 5.5%. What is the expected return on the market? Use the SML equation to calculate the two companies' required returns. 8. If you formed a portfolio that consisted of 50% Company! stock and 50% Company 2 stock, what would be its beta and its required return? How will the portfolio hedge the risk? 9. Suppose an investor wants to include any one of the two stocks that you recommended in his or her portfolio. Stocks A, B, and C are currently in the portfolio, and their betas are 0.869, 1.985, and 1.02, respectively. Recommend a stock from the two stocks you've selected to her/him and calculate the new portfolio's required return if it consists of 25% of the company you've recommended, 15% of Stock A, 40% of Stock B, and 20% of Stock C. Give your comments to risk of the new portfolio. Do you recommend it or not? And why? Question 1: Stock market Rate and Return. (2 marks each, total 18 marks) Instructions: D) You must complete the assignment individually. Any collusion will lead to a zero mark and will be reported to the academic office 2) The data source and reference must be in APA format. 3) All the sub questions (expect part 1) must include definition, calculation and comments. For example, the pros and cons of a method, critics of a model or a theory You must write in complete sentences and paragraphs, minimum 2 paragraphs for each sub-question Assume that you recently graduated with an MBA degree and have just landed a job as a financial planner with Henry's Investment Inc, Your first assignment is to create a portfolio for a client by selecting two stocks on the market 1. You need to complete the below table by selecting ANY two stocks (except for Microsoft) on Nasdaq and collect the data on Dec 31 each year (or the last trading day in that year) Company Name puis en Year 2019 2011 2015 2. Use the data you have collected to calculate annual returns for Company 1. Company 2, and the Market Index, and then calculate average returns over the five-year period Give comments on your calculation results. Which stock has a higher return? 3. Calculate the standard deviation of the returns for Company 1. Company 2, and the Market Index. Do you think the standard deviation can reflect the stocks risks? And why? 4. Construct a scatter diagram graph that shows Company I's and Company 2's returns on the vertical axis and the Market Index's returns on the horizontal axis What's the relationship between the two stocks from your observation? 5. Estimate or use data to find Company I's and Company 2's betas, as the slopes of regression lines with stock returns on the vertical axis (y-axis) and market return on the horizontal axis (x-axis). Are these betas consistent with your graph? Do you think beta can reflect the stocks' risks? And why? 6. You need to determine the risk-free rate. What will be your approach and why do you select this method? How much the rate will be? 7. What's the market risk premium? Assume that the market risk premium is 5.5%. What is the expected return on the market? Use the SML equation to calculate the two companies' required returns 8. If you formed a portfolio that consisted of 50% Company stock and 50% Company 2 stock, what would be its beta and its required return? How will the portfolio hedge the risk? 2. Use the data you have collected to calculate annual returns for Company 1, Company 2, and the Market Index, and then calculate average returns over the five-year period. Give comments on your calculation results. Which stock has a higher return? 3. Calculate the standard deviation of the returns for Company 1, Company 2, and the Market Index. Do you think the standard deviation can reflect the stocks' risks? And why? 4. Construct a scatter diagram graph that shows Company I's and Company 2's returns on the vertical axis and the Market Index's returns on the horizontal axis. What's the relationship between the two stocks from your observation? 5. Estimate or use data to find Company I's and Company 2's betas, as the slopes of regression lines with stock returns on the vertical axis (y-axis) and market return on the horizontal axis (x-axis). Are these betas consistent with your graph? Do you think beta can reflect the stocks' risks? And why? 6. You need to determine the risk-free rate. What will be your approach and why do you select this method? How much the rate will be? 7. What's the market risk premium? Assume that the market risk premium is 5.5%. What is the expected return on the market? Use the SML equation to calculate the two companies' required returns. 8. If you formed a portfolio that consisted of 50% Company! stock and 50% Company 2 stock, what would be its beta and its required return? How will the portfolio hedge the risk? 9. Suppose an investor wants to include any one of the two stocks that you recommended in his or her portfolio. Stocks A, B, and C are currently in the portfolio, and their betas are 0.869, 1.985, and 1.02, respectively. Recommend a stock from the two stocks you've selected to her/him and calculate the new portfolio's required return if it consists of 25% of the company you've recommended, 15% of Stock A, 40% of Stock B, and 20% of Stock C. Give your comments to risk of the new portfolio. Do you recommend it or not? And why
Step by Step Solution
There are 3 Steps involved in it

Get step-by-step solutions from verified subject matter experts