

Question: Question 1 - Summary of a categorical variable The distribution of responses to the statement I enjoy my work' for a random sample of 1,500
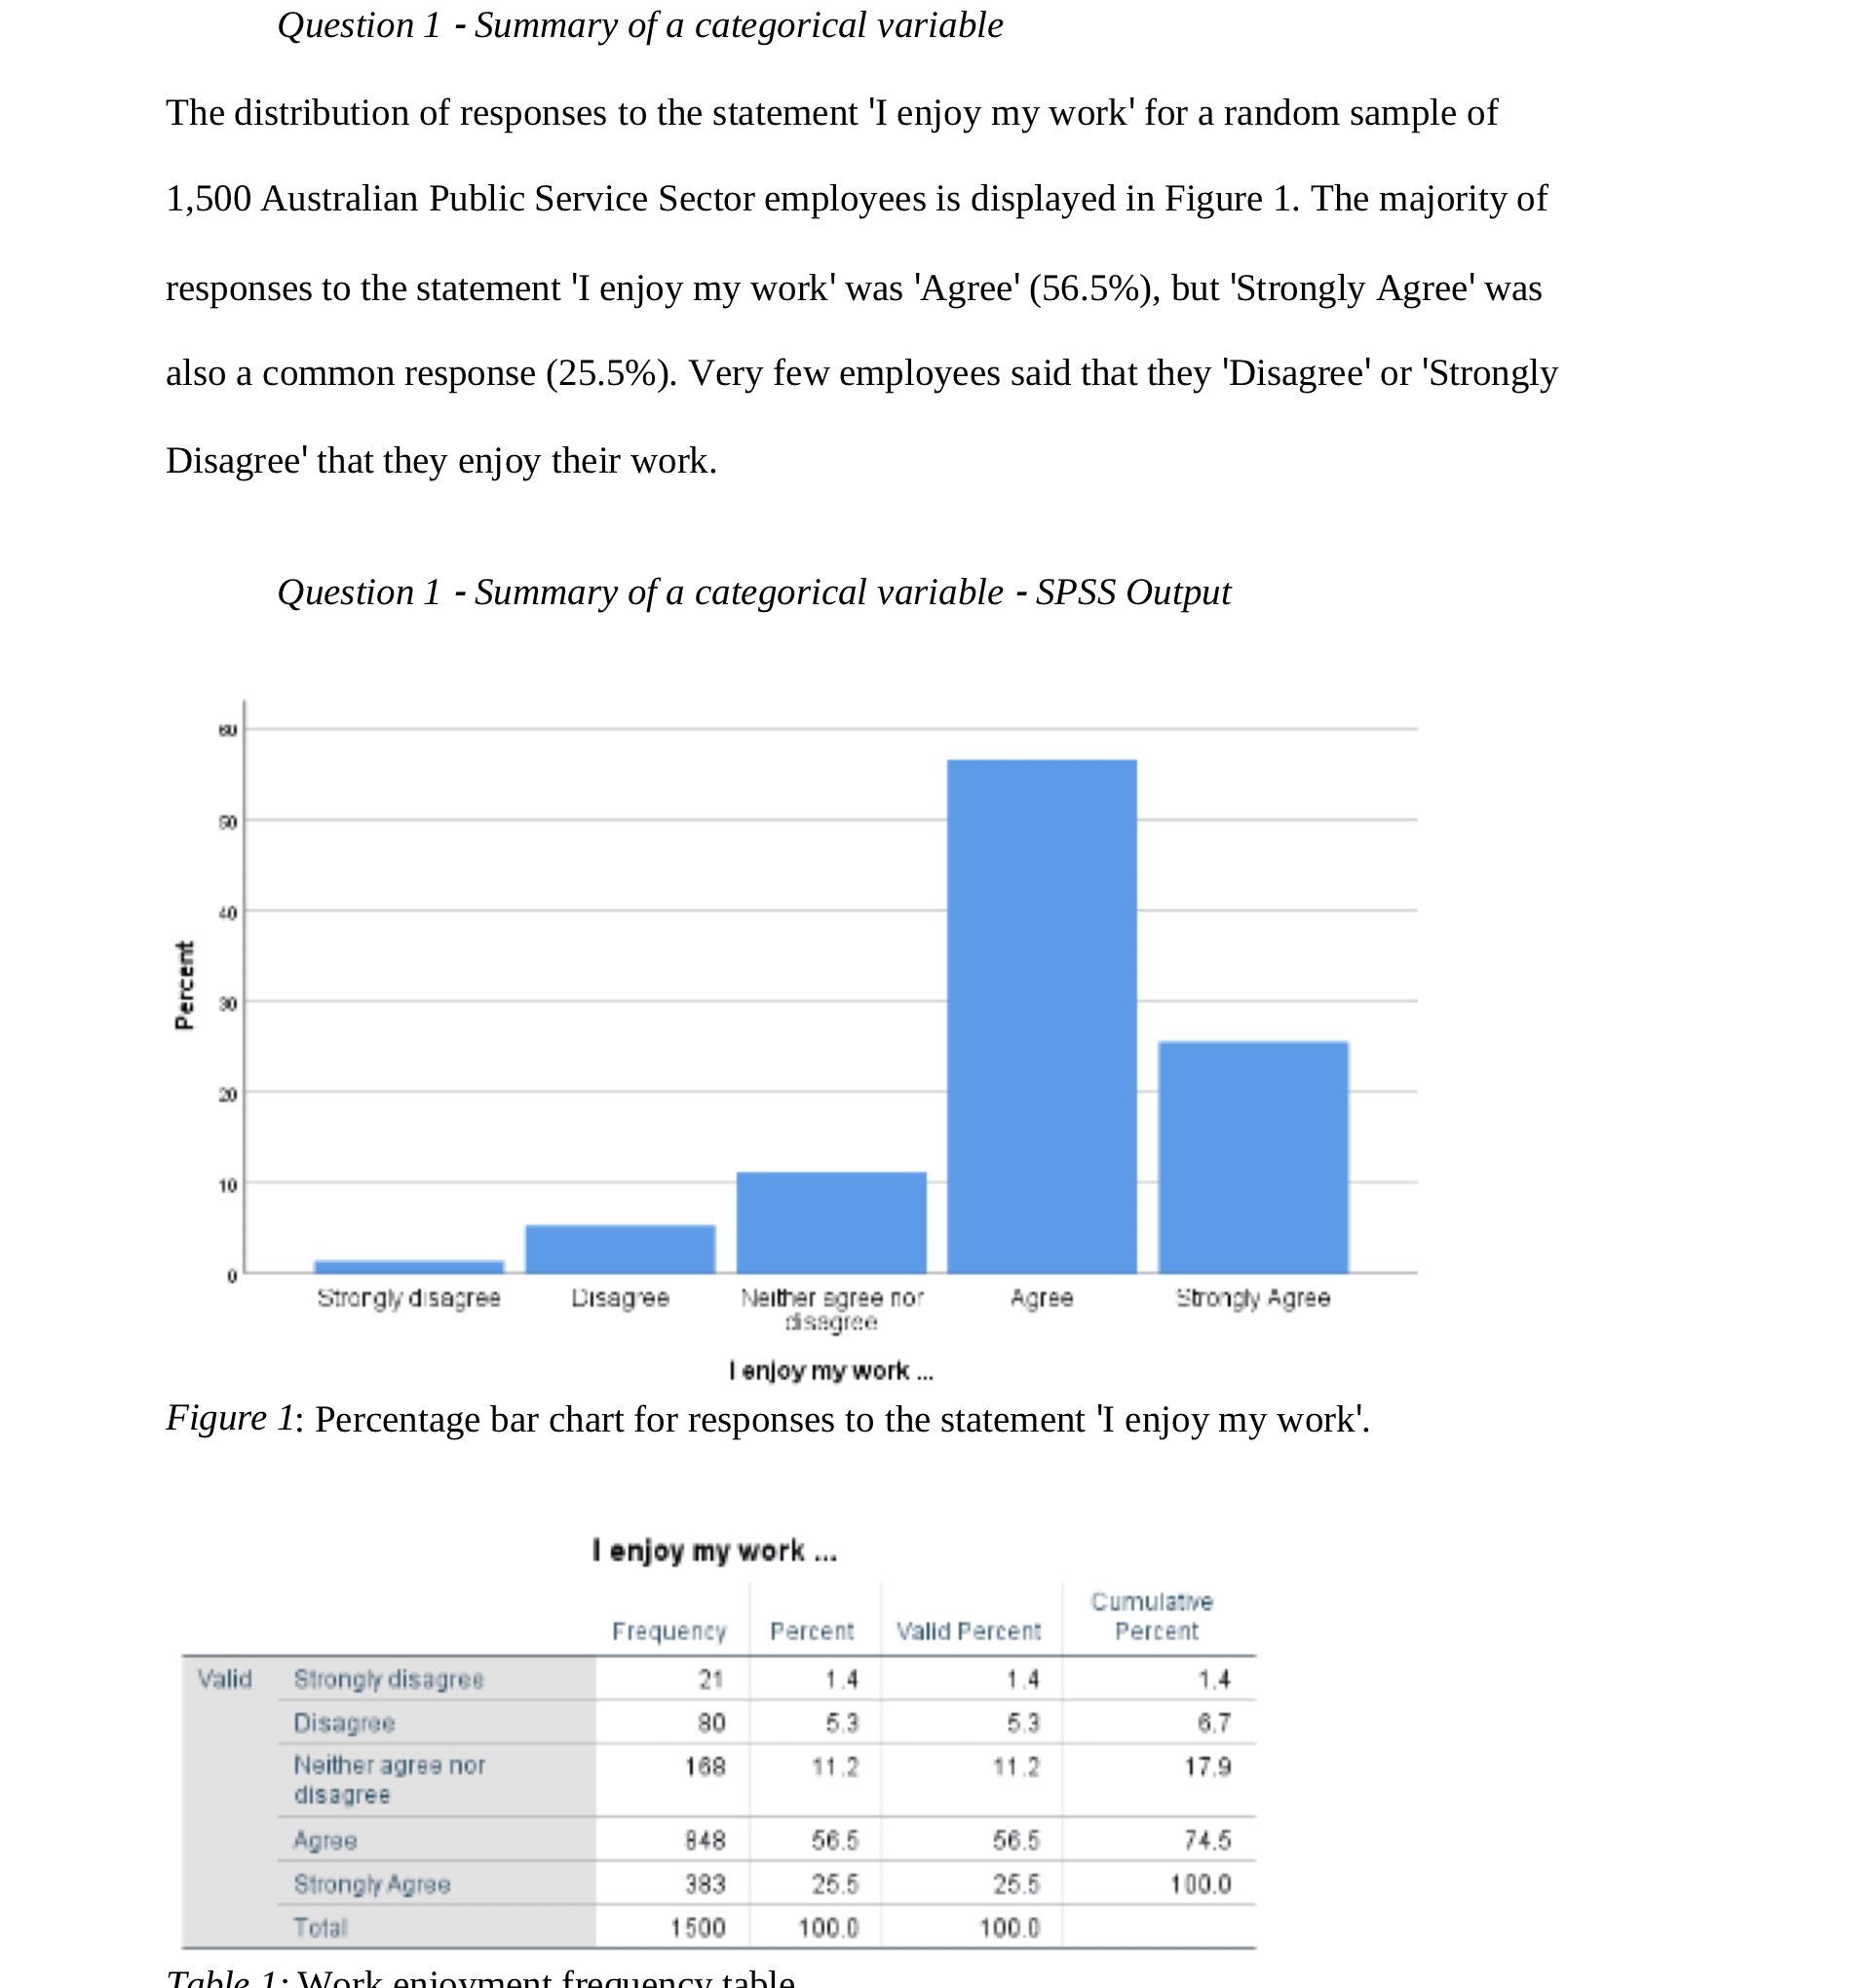

Question 1 - Summary of a categorical variable The distribution of responses to the statement "I enjoy my work' for a random sample of 1,500 Australian Public Service Sector employees is displayed in Figure 1. The majority of responses to the statement 'I enjoy my work' was 'Agree' (56.5%), but 'Strongly Agree' was also a common response (25.5%). Very few employees said that they 'Disagree' or 'Strongly Disagree' that they enjoy their work. Question 1 - Summary of a categorical variable - SPSS Output 40 Percent 20 10 Strongly disagree Disagree Neither agree nor Agree Strongly Agree disagree I enjoy my work ... Figure 1: Percentage bar chart for responses to the statement 'I enjoy my work'. I enjoy my work ... Cumulative Frequency Percent Valid Percent Percent Valid Strongly disagree 21 1.4 1.4 1.4 Disagree 80 5.3 5.3 6.7 Neither agree nor 168 11 2 11 .2 17.9 disagree Agree 848 56.5 56.5 74.5 Strongly Agree 383 25.5 25.5 100.0 Total 1500 100.0 100.0
Step by Step Solution
There are 3 Steps involved in it

Get step-by-step solutions from verified subject matter experts