

Question: Question 1: Supply and Demand for Eggs This chart (when filled in) will show egg consumption per month in Minnesota (population about 5 million) where
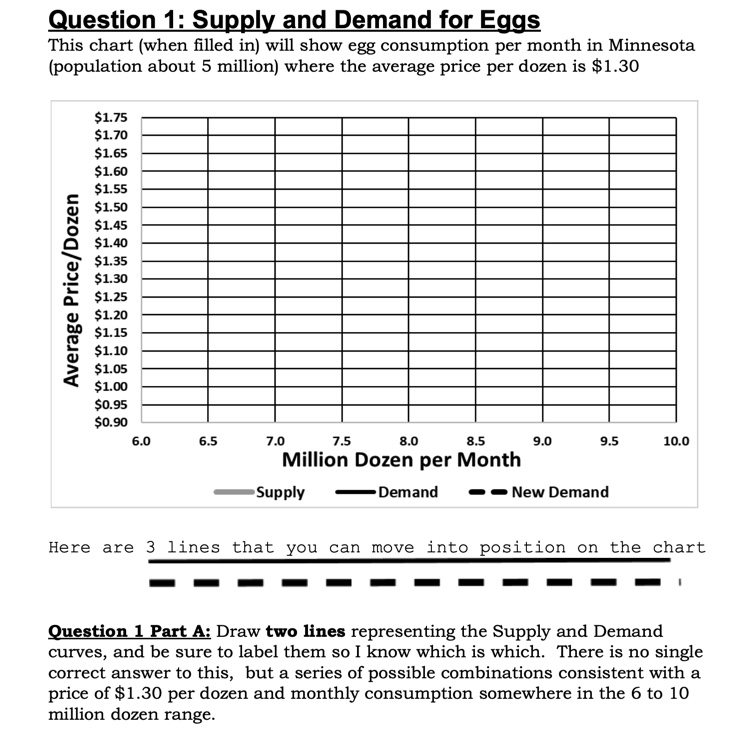
Question 1: Supply and Demand for Eggs This chart (when filled in) will show egg consumption per month in Minnesota (population about 5 million) where the average price per dozen is $1.30 $1.75 $1.70 $1.65 $1.60 Average Price/Dozen $1.55 $1.50 $1.45 $1.40 $1.35 $1.30 $1.20 $1.15 $1.10 $1.05 $1.00 $0.95 $0.90 6.0 6.5 7.0 7.5 8.0 8.5 9.0 9.5 10.0 Million Dozen per Month -Supply - Demand - - New Demand Here are 3 lines that you can move into position on the chart Question 1 Part A: Draw two lines representing the Supply and Demand curves, and be sure to label them so I know which is which. There is no single correct answer to this, but a series of possible combinations consistent with a price of $1.30 per dozen and monthly consumption somewhere in the 6 to 10 million dozen range
Step by Step Solution
There are 3 Steps involved in it

Get step-by-step solutions from verified subject matter experts