

Question: Question 1: Suppose that the average waiting time for a patient at a physician's office is just over 29 minutes. In order to address the
Question 1:
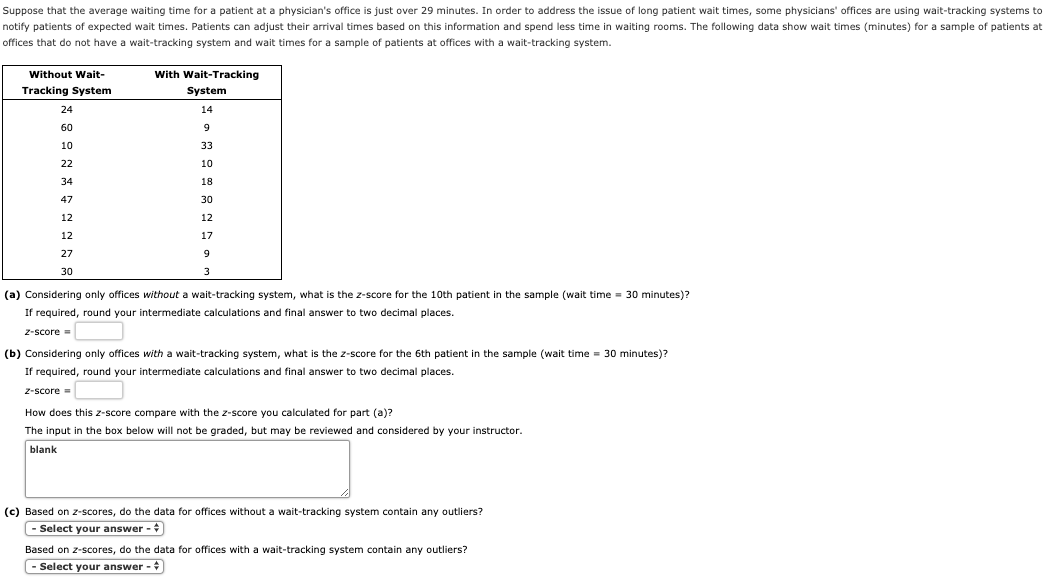
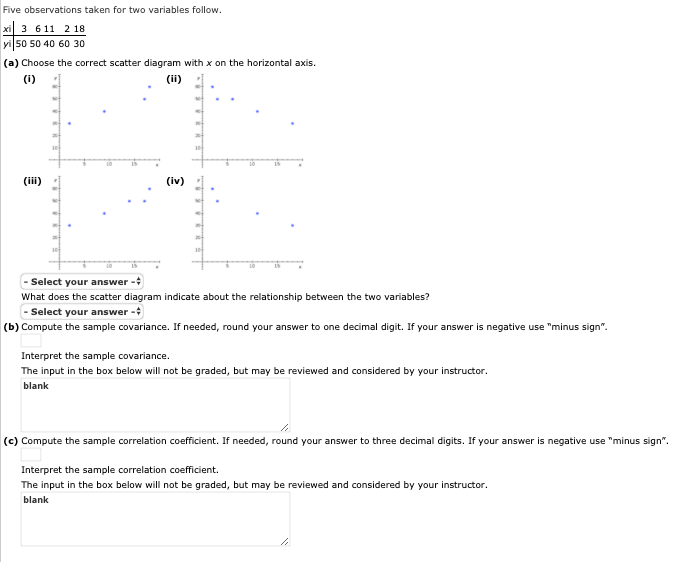
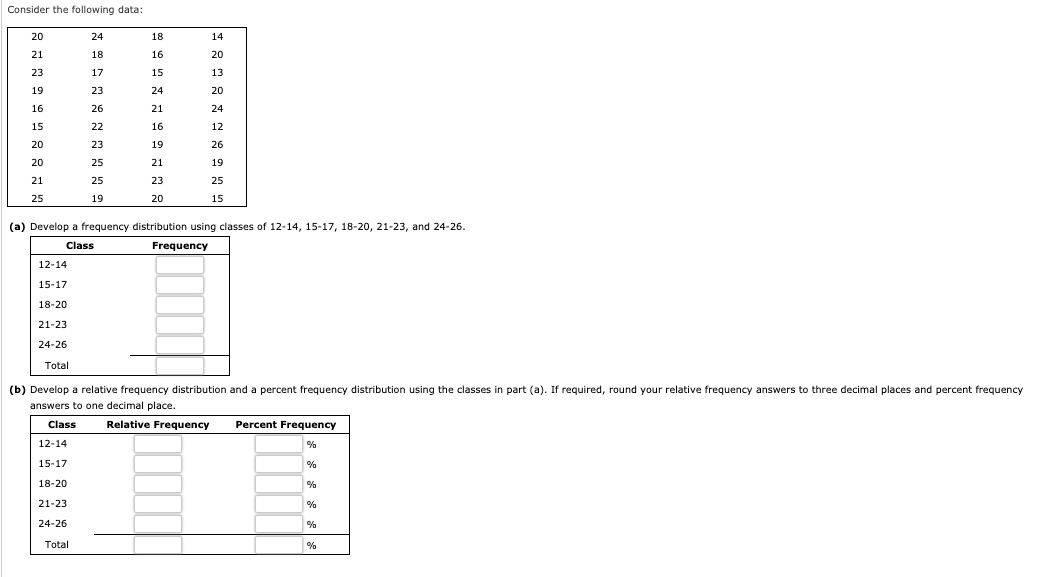
Suppose that the average waiting time for a patient at a physician's office is just over 29 minutes. In order to address the issue of long patient wait times, some physicians' offices are using wait-tracking systems to notify patients of expected wait times. Patients can adjust their arrival times based on this information and spend less time in waiting rooms. The following data show wait times (minutes) for a sample of patients at offices that do not have a wait-tracking system and wait times for a sample of patients at offices with a wait-tracking system. Without Wait- With Wait-Tracking Tracking System System 24 14 60 9 10 33 22 10 34 18 47 30 12 12 12 17 27 30 W ID (a) Considering only offices without a wait-tracking system, what is the z-score for the 10th patient in the sample (wait time = 30 minutes)? If required, round your intermediate calculations and final answer to two decimal places. 2-score = (b) Considering only offices with a wait-tracking system, what is the z-score for the 6th patient in the sample (wait time = 30 minutes)? If required, round your intermediate calculations and final answer to two decimal places. 2-score = How does this z-score compare with the z-score you calculated for part (a)? The input in the box below will not be graded, but may be reviewed and considered by your instructor. blank (c) Based on z-scores, do the data for offices without a wait-tracking system contain any outliers? - Select your answer - + Based on 2-scores, do the data for offices with a wait-tracking system contain any outliers? - Select your answer -Five observations taken for two variables follow. xi 3 611 2 18 vi 50 50 40 60 30 (a) Choose the correct scatter diagram with x on the horizontal axis. (1) (ii) [iv) - Select your answer -; What does the scatter diagram indicate about the relationship between the two variables? - Select your answer -$ (b) Compute the sample covariance. If needed, round your answer to one decimal digit. If your answer is negative use "minus sign". Interpret the sample covariance. The input in the box below will not be graded, but may be reviewed and considered by your instructor. blank (c) Compute the sample correlation coefficient. If needed, round your answer to three decimal digits. If your answer is negative use "minus sign". Interpret the sample correlation coefficient. The input in the box below will not be graded, but may be reviewed and considered by your instructor. blankSelect your answer Positive non-linear Positive linear Stationary Negative linear Negative non-linearConsider the following data: 20 24 18 14 21 18 16 20 23 17 15 13 19 23 24 20 16 26 21 24 15 22 16 12 20 23 19 26 20 25 21 19 21 25 23 25 25 19 20 15 (a) Develop a frequency distribution using classes of 12-14, 15-17, 18-20, 21-23, and 24-26. Class Frequency 12-14 15-17 18-20 21-23 24-26 Total (b) Develop a relative frequency distribution and a percent frequency distribution using the classes in part (a). If required, round your relative frequency answers to three decimal places and percent frequency answers to one decimal place. Class Relative Frequency Percent Frequency 12-14 15-17 18-20 21-23 24-26 Total
Step by Step Solution
There are 3 Steps involved in it

Get step-by-step solutions from verified subject matter experts