

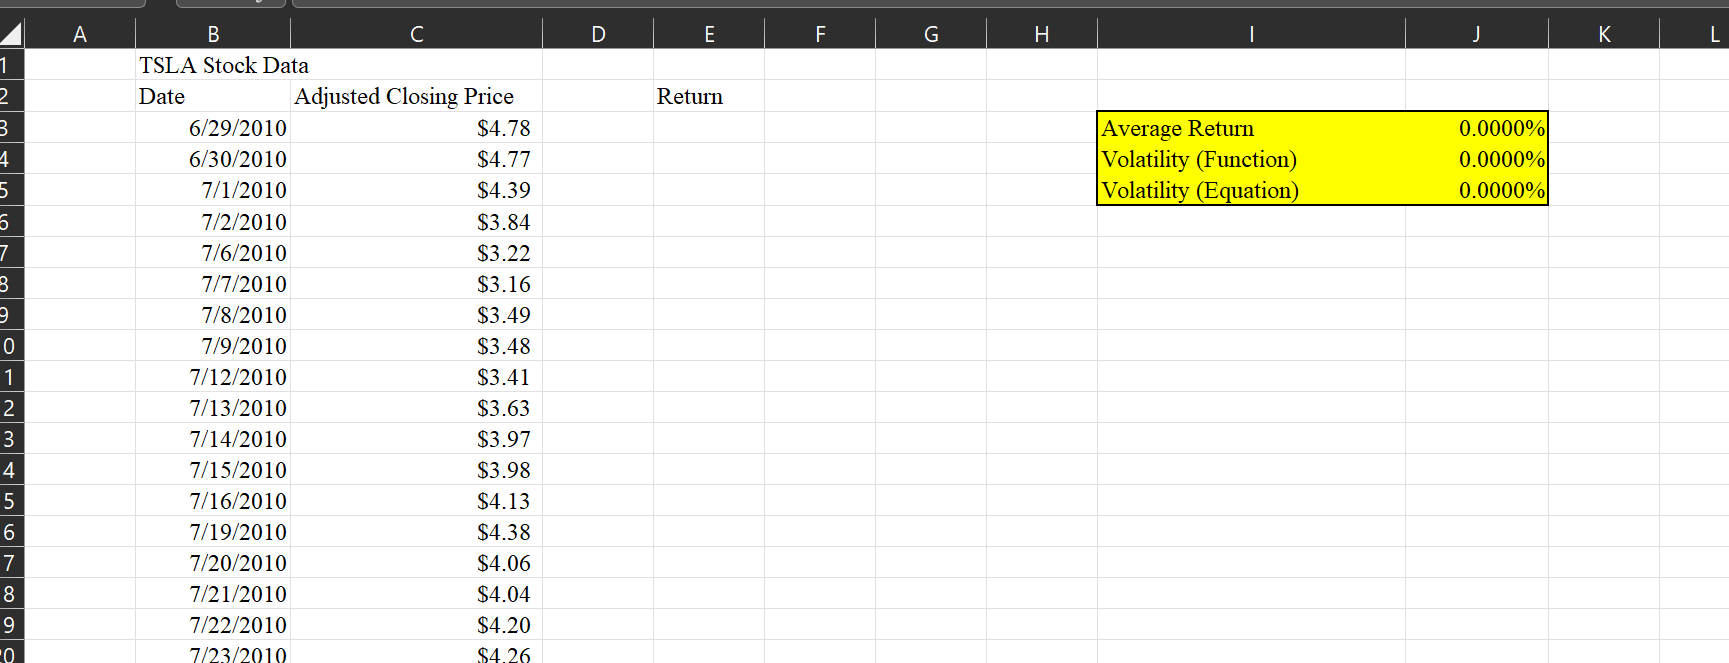
Question: Question 1 tab in the spreadsheet contains daily price data for Tesla (ticker: TSLA) from its first trading day until now. Find the average return
Question 1 tab in the spreadsheet contains daily price data for Tesla (ticker: TSLA) from its first trading day until now. Find the average return and volatility (using both the built-in Excel function and the equation from my lecture notes). To do this, you'll first need to fill in the return column in the spreadsheet.
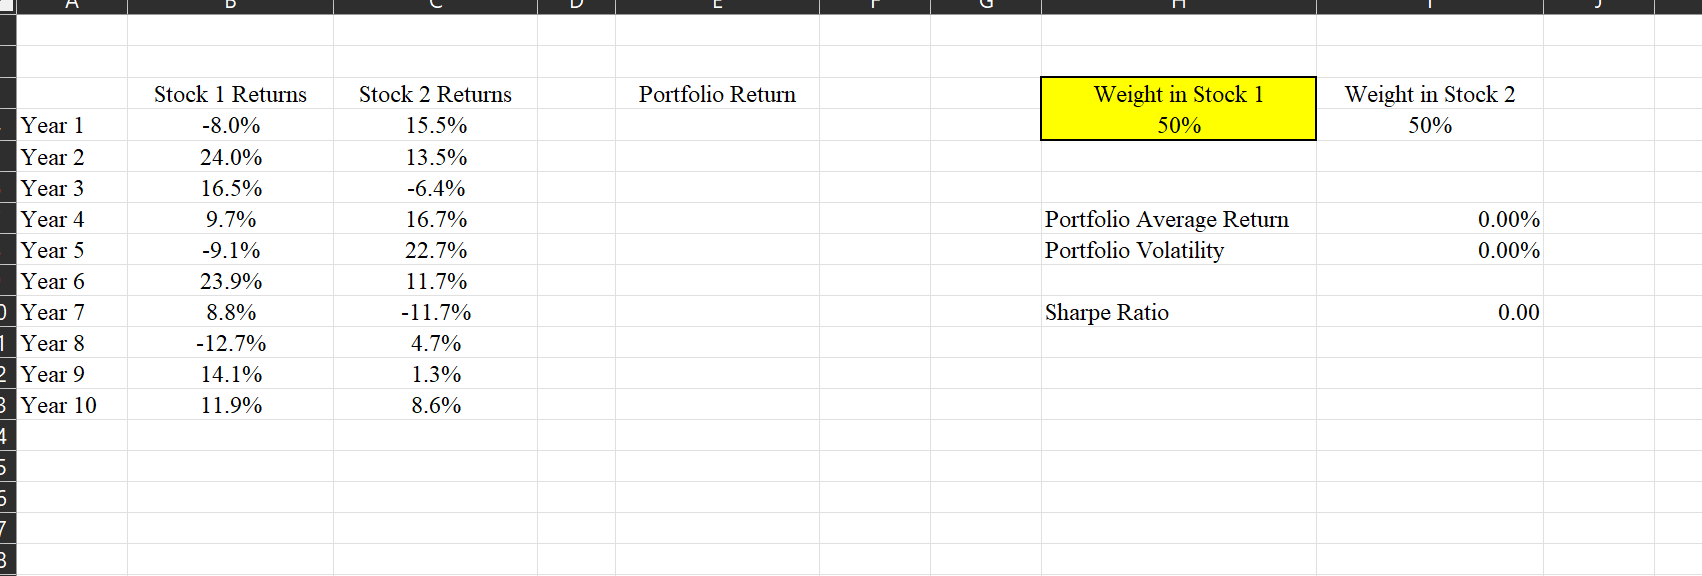
Question 2 One way to use the Sharpe Ratio is to find a best" portfolio. The Question 2 tab in the spreadsheet contains 10 years of returns for two stocks. Your goal is to find the optimal weights (by which I mean the weights that result in the highest Sharpe Ratio) for stock 1 and 2. Note that for computational purposes, you only need to find the weight for stock 1 (since Stock 2 will be whatever is left over to make the total 100%. I've used this fact in the spreadsheet FYI.) To find the weight, you'll first need to use the weights to calculate the Portfolio Return column, which you'll need to fill in the Average Return and Volatility cells on the right. For the Sharpe Ratio, you can assume that the risk-free rate is 0.5%. Once you've set up the calculations, you can run solver to find the weight in stock 1.
Step by Step Solution
There are 3 Steps involved in it

Get step-by-step solutions from verified subject matter experts