

Question: Table 1 shows the changes in residential prices in Peninsular Malaysia over six years. Answer ALL the following questions to explain the changes of residential
Table 1 shows the changes in residential prices in Peninsular Malaysia over six years. Answer ALL the following questions to explain the changes of residential prices in the Peninsular States from year 2007 to 2012.
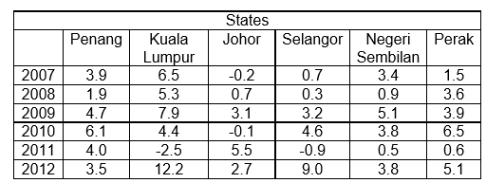
(a) Based on the data in Table 1 below, explain the changes of residential prices in the States of Peninsular Malaysia from the year 2007 to 2012.
(b) Can we draw a conclusion that KL or Penang residential prices are higher than other Peninsular states? Explain your answer.
States Penang Kuala Johor Selangor Negeri Sembilan 3.4 Perak Lumpur 6.5 2007 2008 2009 2010 3.9 -0.2 0.7 0.7 1.5 1.9 5.3 7.9 4.4 0.3 0.9 3.6 3.9 6.5 3.2 4.7 6.1 3.1 -0.1 5.1 3.8 4.6 2011 -2.5 12.2 4.0 5.5 -0.9 0.5 0.6 2012 3.5 2.7 9.0 3.8 5.1
Step by Step Solution
3.52 Rating (155 Votes )
There are 3 Steps involved in it
A 1 For Penang We can analyse here that from 20072012 the o... View full answer

Get step-by-step solutions from verified subject matter experts