

Question: Question 1 . The distribution network shown in the figure below is fed from node 1 and the piezometric elevation at this point is 1
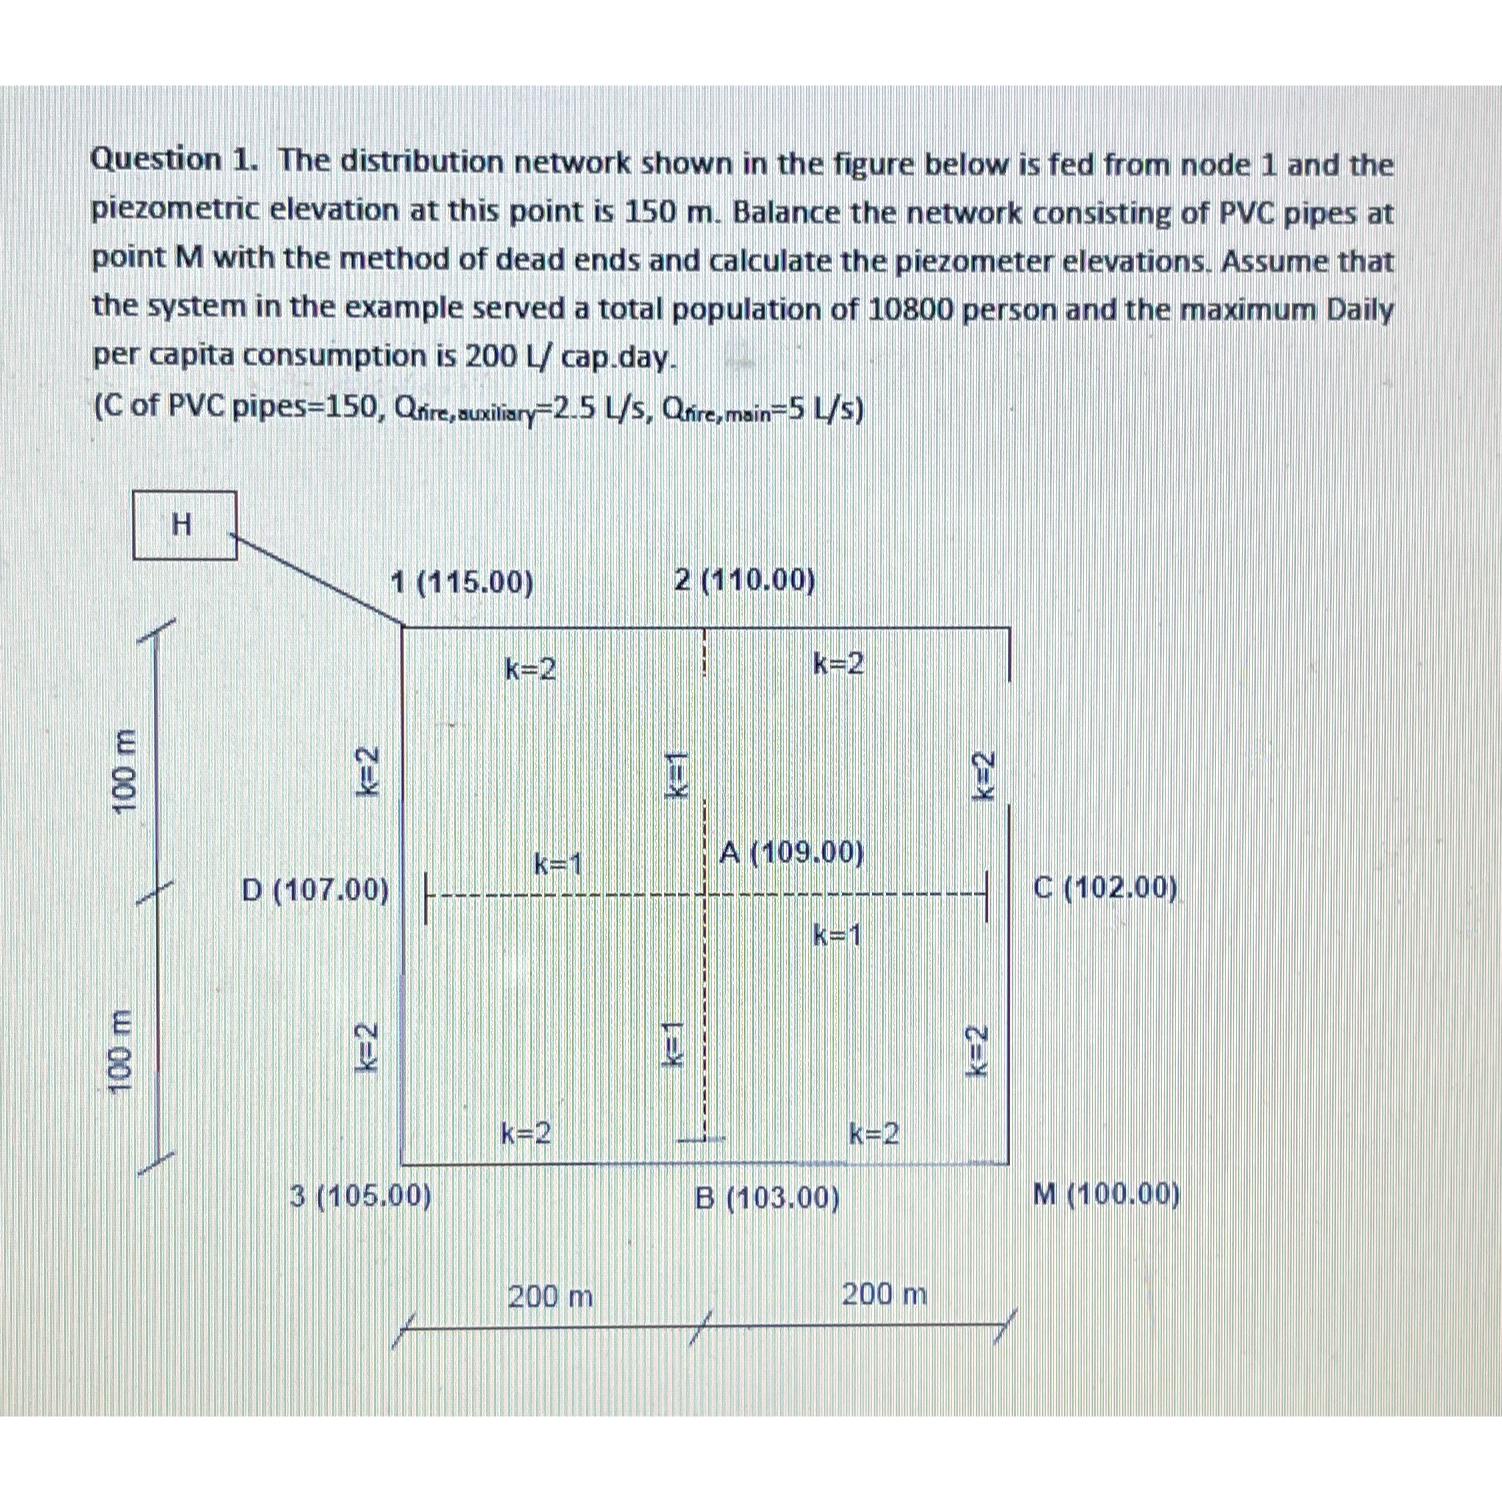
Question The distribution network shown in the figure below is fed from node and the piezometric elevation at this point is Balance the network consisting of PVC pipes at point with the method of dead ends and calculate the piezometer elevations. Assume that the system in the example served a total population of person and the maximum Daily per capita consumption is
C of PVC pipes Qfire, auxiliary
Step by Step Solution
There are 3 Steps involved in it
1 Expert Approved Answer
Step: 1 Unlock

Question Has Been Solved by an Expert!
Get step-by-step solutions from verified subject matter experts
Step: 2 Unlock
Step: 3 Unlock