

Question: Question 1: The following data and table illustrate a small project: Activity A was completed on schedule Activity B started as planned but it is
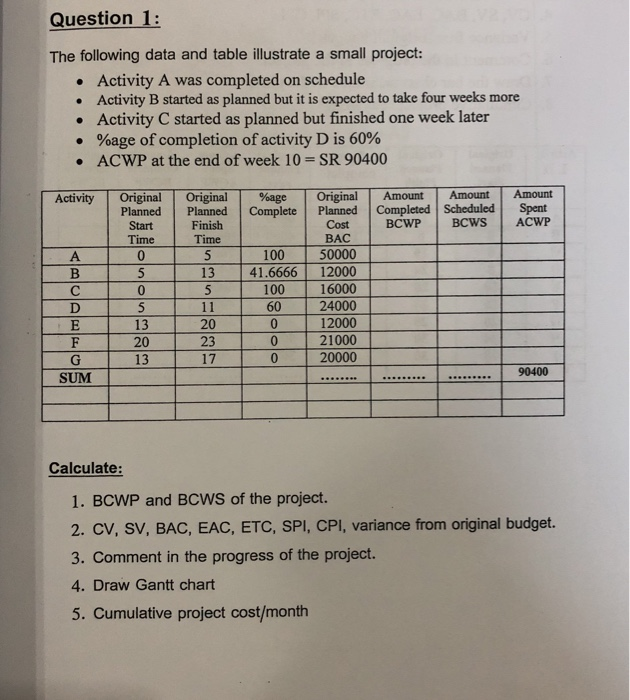
Question 1: The following data and table illustrate a small project: Activity A was completed on schedule Activity B started as planned but it is expected to take four weeks more Activity C started as planned but finished one week later %age of completion of activity D is 60% ACWP at the end of week 10 = SR 90400 Activity Original Planned Start Time Original Planned Finish Time Wage Complete Amount Completed BCWP Amount Scheduled BCWS Amount Spent ACWP 100 41.6666 100 Original Planned Cost BAC 50000 12000 16000 24000 12000 21000 20000 60 0 0 SUM 90400 Calculate: 1. BCWP and BCWS of the project. 2. CV, SV, BAC, EAC, ETC, SPI, CPI, variance from original budget. 3. Comment in the progress of the project. 4. Draw Gantt chart 5. Cumulative project cost/month
Step by Step Solution
There are 3 Steps involved in it

Get step-by-step solutions from verified subject matter experts