

Question: . Question 1 The following histograms are from random samples of 100 data values taken from four different distributions. Match the graph to the correct
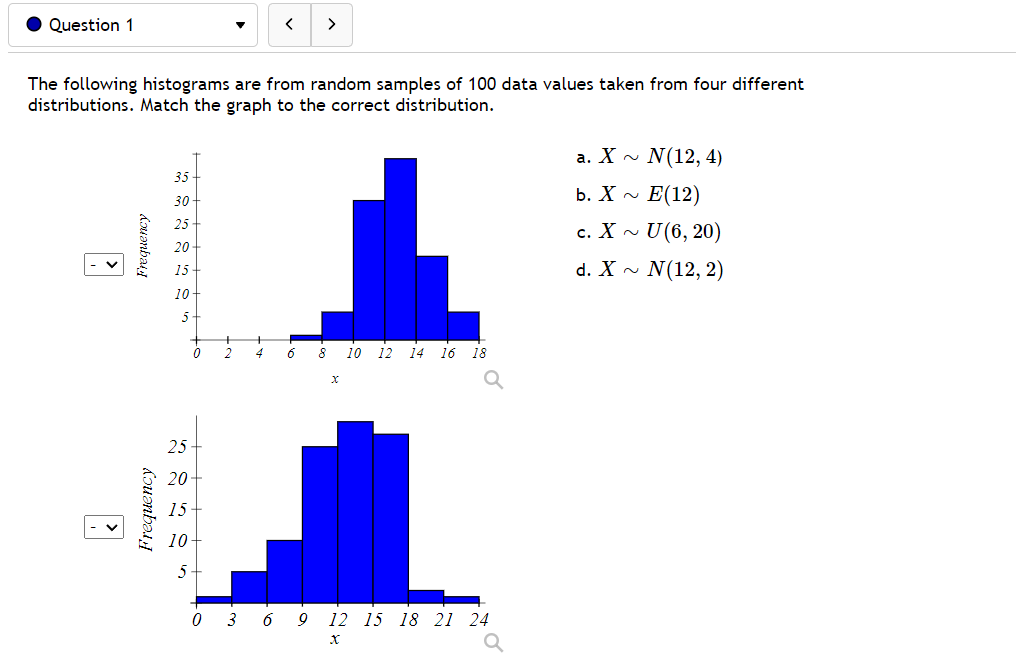
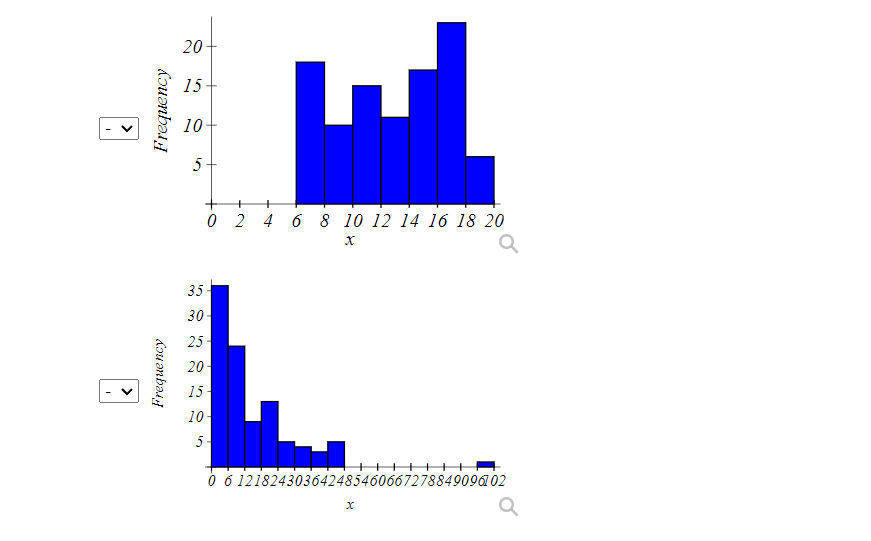


. Question 1 The following histograms are from random samples of 100 data values taken from four different distributions. Match the graph to the correct distribution. a. X ~ N(12, 4) 35 30 b. X ~ E(12) 25 c. X ~ U(6, 20) Frequency 20 - v 15 d. X ~ N(12, 2) 10 4 6 10 12 14 16 18 X Q 25 20- Frequency 15 - v 10 0 3 6 9 12 15 18 21 24 X Q
Step by Step Solution
There are 3 Steps involved in it
1 Expert Approved Answer
Step: 1 Unlock

Question Has Been Solved by an Expert!
Get step-by-step solutions from verified subject matter experts
Step: 2 Unlock
Step: 3 Unlock