

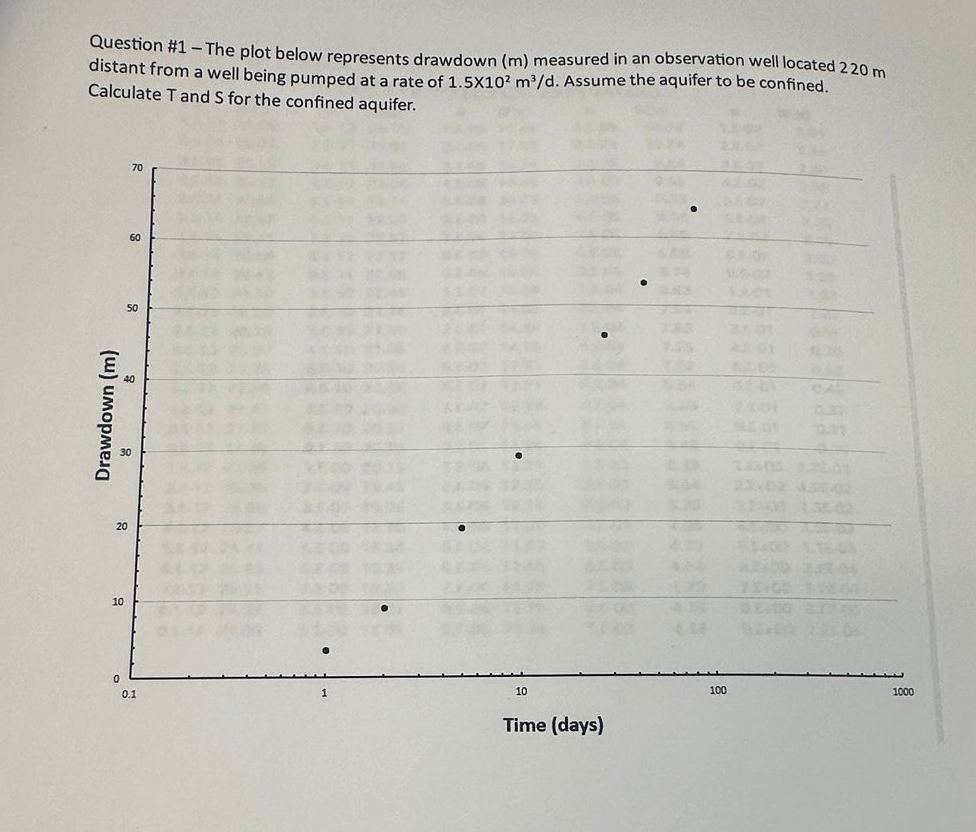
Question: Question # 1 - The plot below represents drawdown ( m ) measured in an observation well located 2 2 0 m distant from a
Question # The plot below represents drawdown measured in an observation well located distant from a well being pumped at a rate of Assume the aquifer to be confined. Calculate and for the confined aquifer.
Step by Step Solution
There are 3 Steps involved in it
1 Expert Approved Answer
Step: 1 Unlock

Question Has Been Solved by an Expert!
Get step-by-step solutions from verified subject matter experts
Step: 2 Unlock
Step: 3 Unlock