

Question: QUESTION 1 The table below lists the average weekly earnings for the 10 province in 2005 and 2010 (fictitious data). Compute the mean and median
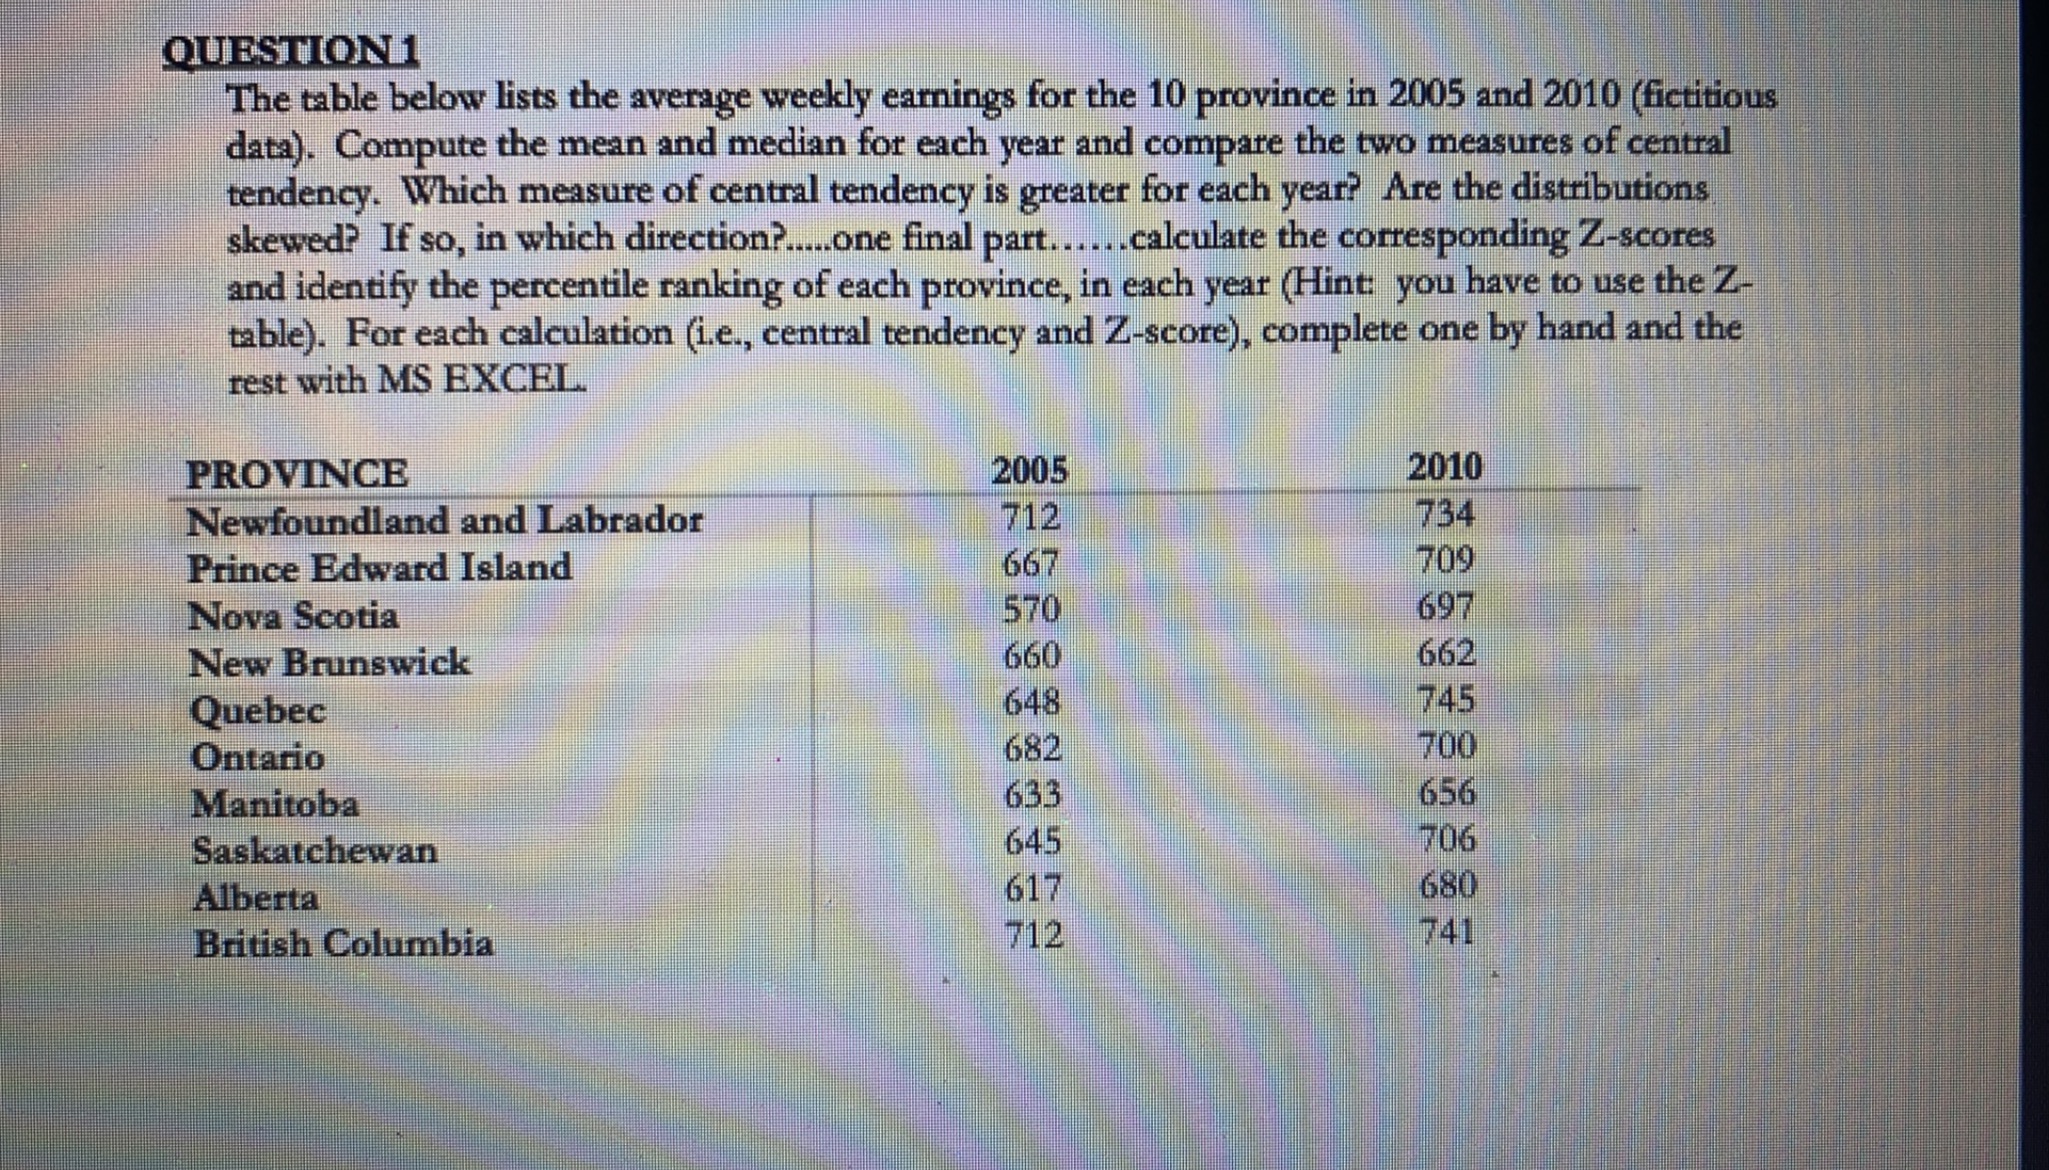
QUESTION 1 The table below lists the average weekly earnings for the 10 province in 2005 and 2010 (fictitious data). Compute the mean and median for each year and compare the two measures of central tendency. Which measure of central tendency is greater for each year? Are the distributions skewed? If so, in which direction?..one final part......calculate the corresponding Z-scores and identify the percentile ranking of each province, in each year (Hint: you have to use the Z- table). For each calculation (i.e., central tendency and 2-score), complete one by hand and the rest with MS EXCEL. PROVINCE 2005 2010 Newfoundland and Labrador 712 734 Prince Edward Island 667 709 Nova Scotia 570 697 New Brunswick 660 662 Quebec 648 745 Ontario 682 700 Manitoba 633 656 Saskatchewan 645 706 Alberta 617 680 British Columbia 712 741
Step by Step Solution
There are 3 Steps involved in it

Get step-by-step solutions from verified subject matter experts