

Question: QUESTION 1 The table below shows two hours near the maximum of the design hyetograph based on the NRCS Type II rainfall distribution. What is
QUESTION
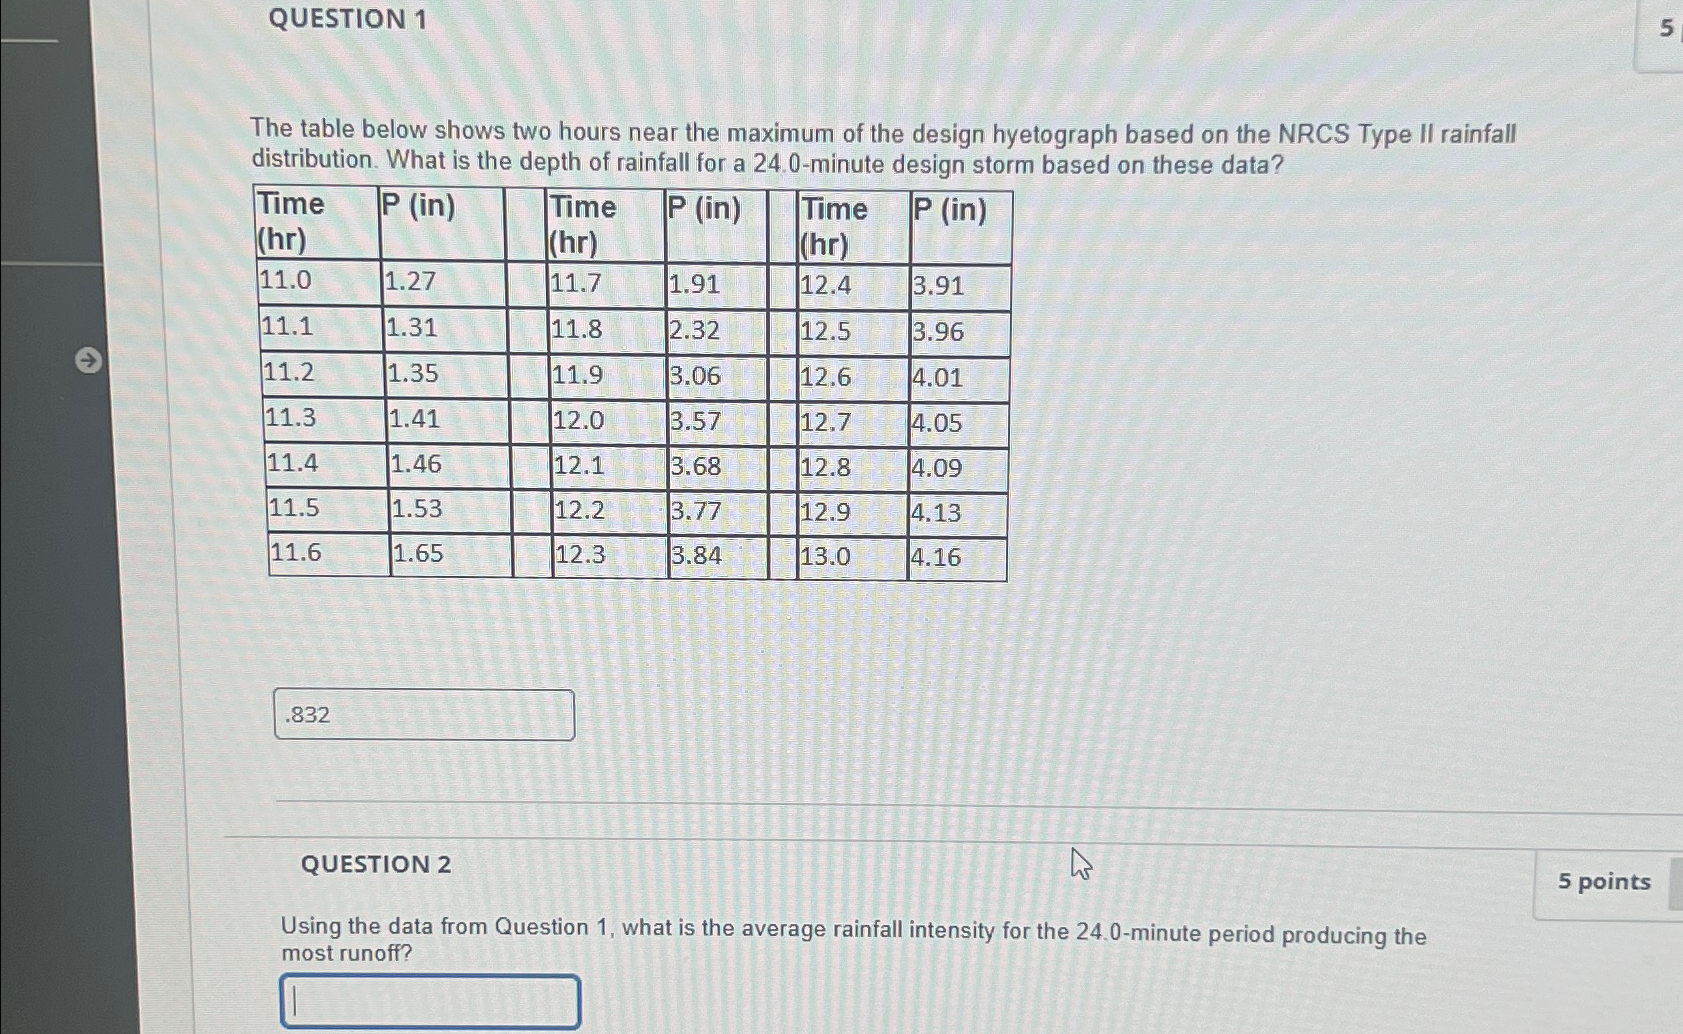
The table below shows two hours near the maximum of the design hyetograph based on the NRCS Type II rainfall distribution. What is the depth of rainfall for a minute design storm based on these data?
tabletableTimehrintableTimehrintableTimehrin
QUESTION
Using the data from Question what is the average rainfall intensity for the minute period producing the most runoff?
Step by Step Solution
There are 3 Steps involved in it
1 Expert Approved Answer
Step: 1 Unlock

Question Has Been Solved by an Expert!
Get step-by-step solutions from verified subject matter experts
Step: 2 Unlock
Step: 3 Unlock