

Question: Question 1. The table below summarizes recent employment data in the U.S. Category Number (thousands of persons) Jul-13 Aug-13 Jul-14 Aug-14 Employed workers 144,285 144,170
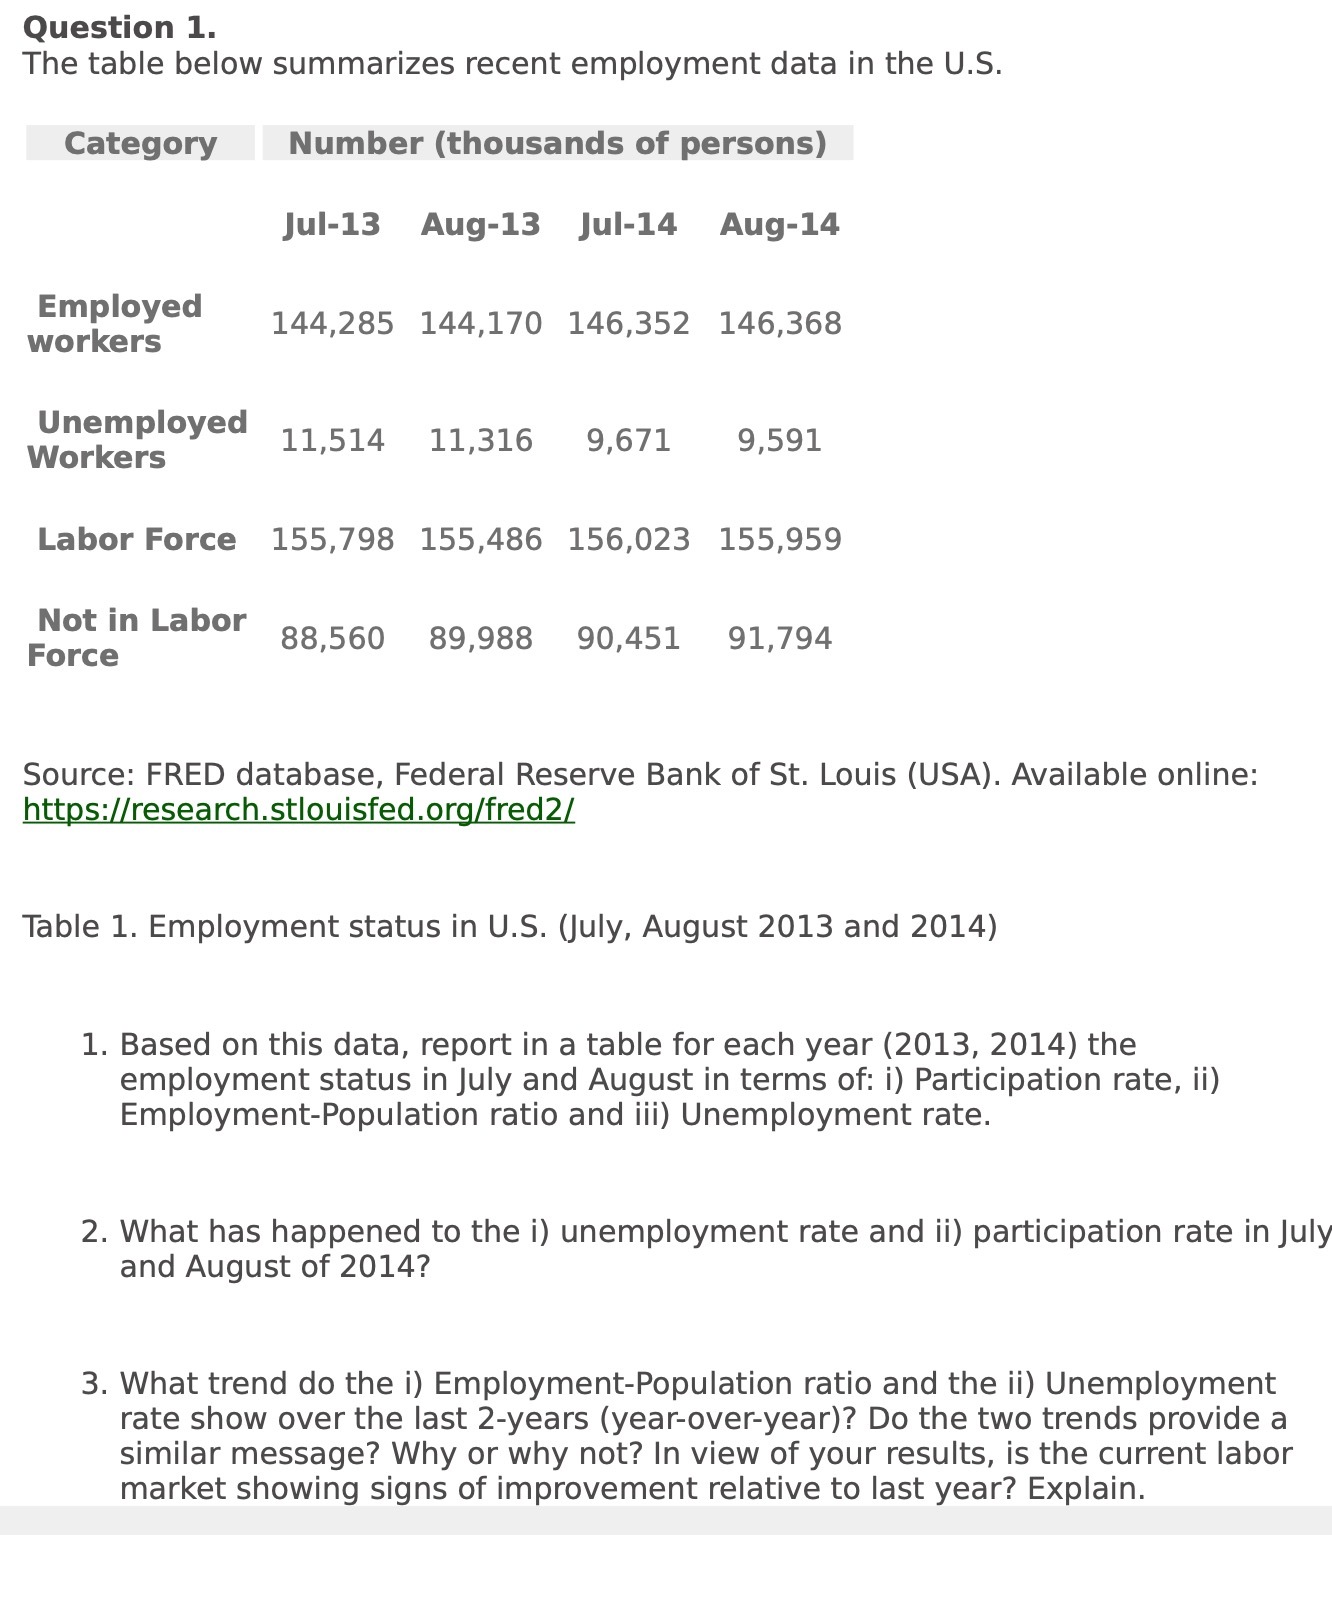
Question 1. The table below summarizes recent employment data in the U.S. Category Number (thousands of persons) Jul-13 Aug-13 Jul-14 Aug-14 Employed workers 144,285 144,170 146,352 146,368 Unemployed Workers 11,514 11,316 9,671 9,591 Labor Force 155,798 155,486 156,023 155,959 Not in Labor Force 88,560 89,988 90,451 91,794 Source: FRED database, Federal Reserve Bank of St. Louis (USA). Available online: https://research.stlouisfed.org/fred2/ Table 1. Employment status in U.S. (July, August 2013 and 2014) 1. Based on this data, report in a table for each year (2013, 2014) the employment status in July and August in terms of: i) Participation rate, ii) Employment-Population ratio and iii) Unemployment rate. 2. What has happened to the i) unemployment rate and ii) participation rate in July and August of 2014? 3. What trend do the i) Employment-Population ratio and the ii) Unemployment rate show over the last 2-years (year-over-year)? Do the two trends provide a similar message? Why or why not? In view of your results, is the current labor market showing signs of improvement relative to last year? Explain
Step by Step Solution
There are 3 Steps involved in it

Get step-by-step solutions from verified subject matter experts