

Question: Question 1: The tables below show prior, conditional, joint, marginal, and posterior probabilities for 3 states of nature: Good, Fair, and Poor. Encouraging and Discouraging
Question 1:
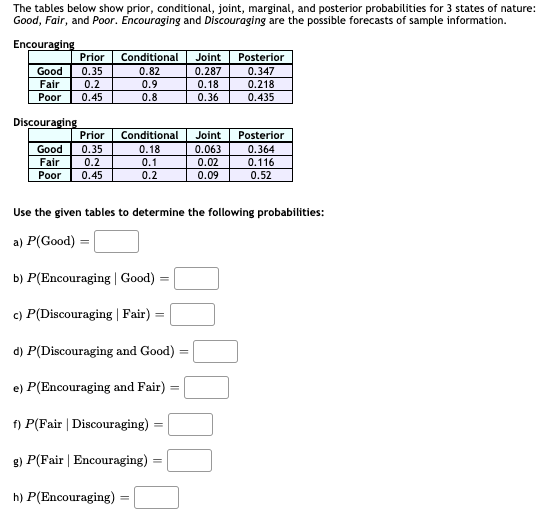
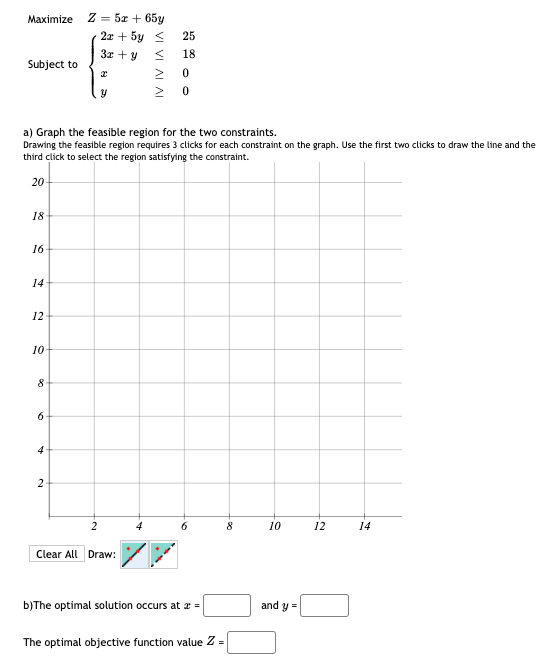
The tables below show prior, conditional, joint, marginal, and posterior probabilities for 3 states of nature: Good, Fair, and Poor. Encouraging and Discouraging are the possible forecasts of sample information. Encouraging Prior Conditional | Joint Posterior Good 0.35 0.82 0.287 0.347 Fair 0.2 0.9 0.18 0.218 Poor 0.45 0.8 0.36 0.435 Discouraging Prior Conditional Joint Posterior Good 0.35 0.18 0.063 0.364 Fair 0.2 D.1 0. 02 0. 116 Poor 0.45 0.2 0.09 0.52 Use the given tables to determine the following probabilities: a) P(Good) = b) P(Encouraging | Good) = c) P(Discouraging | Fair) = d) P(Discouraging and Good) e) P(Encouraging and Fair) = () P(Fair | Discouraging) = g) P(Fair | Encouraging) = h) P(Encouraging) =Maximize Z = 5r + 65y 2x + 5y 25 Subject to 3c + y 18 0 IV a) Graph the feasible region for the two constraints. Drawing the feasible region requires 3 clicks for each constraint on the graph. Use the first two clicks to draw the line and the third click to select the region satisfying the constraint. 20 18 16 14 12 10 4 2 2 10 12 14 Clear All Draw: b) The optimal solution occurs at r = and y = The optimal objective function value Z =
Step by Step Solution
There are 3 Steps involved in it

Get step-by-step solutions from verified subject matter experts