

Question: Question 1 [Unit 1] 7' marks A student is carrying out a biology project on trees. {a} They need to record three pieces of information
![Question 1 [Unit 1] 7' marks A student is carrying out](https://dsd5zvtm8ll6.cloudfront.net/si.experts.images/questions/2024/10/6703ee2d6f4de_8296703ee2d43ffe.jpg)
![[compared to sea level] {ii} The height of the tree {iii} The](https://dsd5zvtm8ll6.cloudfront.net/si.experts.images/questions/2024/10/6703ee2ebcc49_8306703ee2e8495f.jpg)
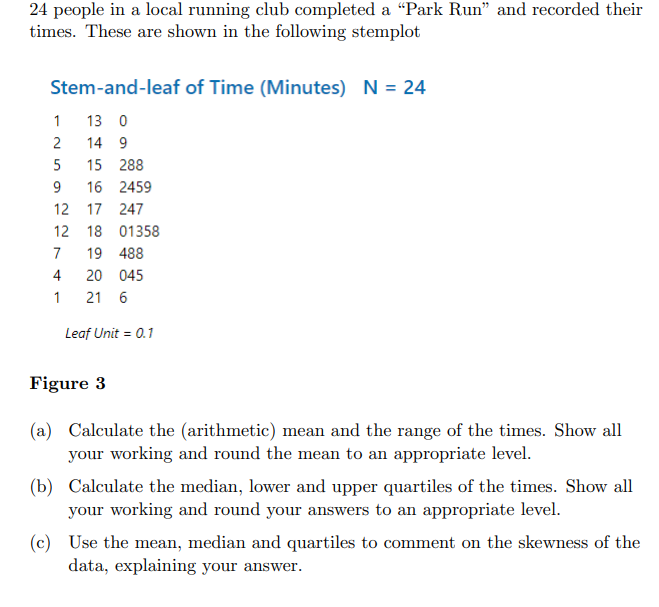
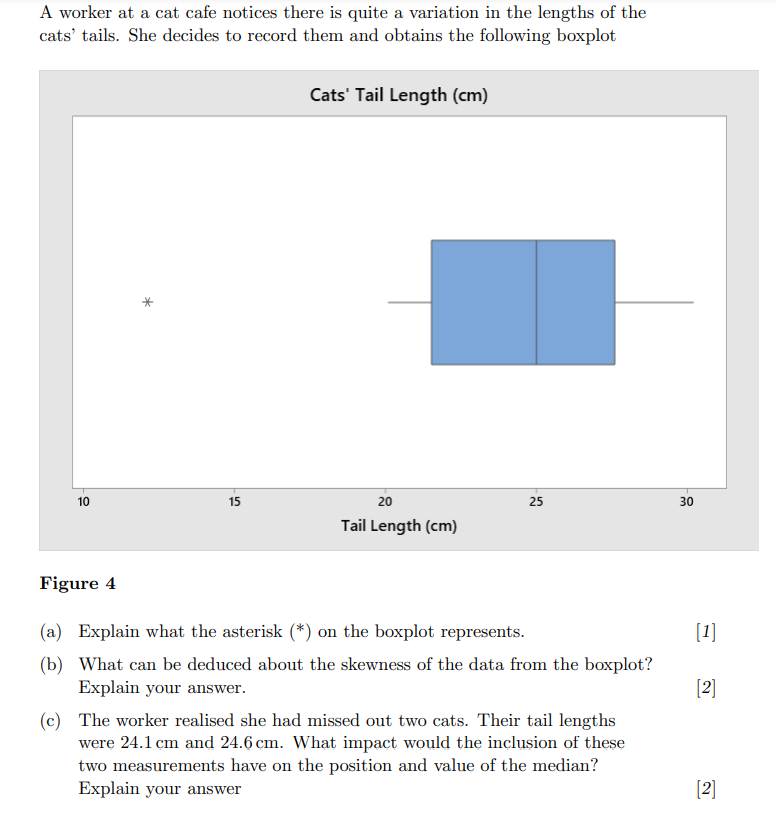
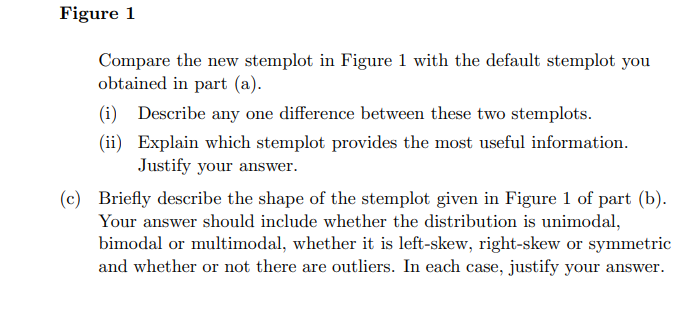
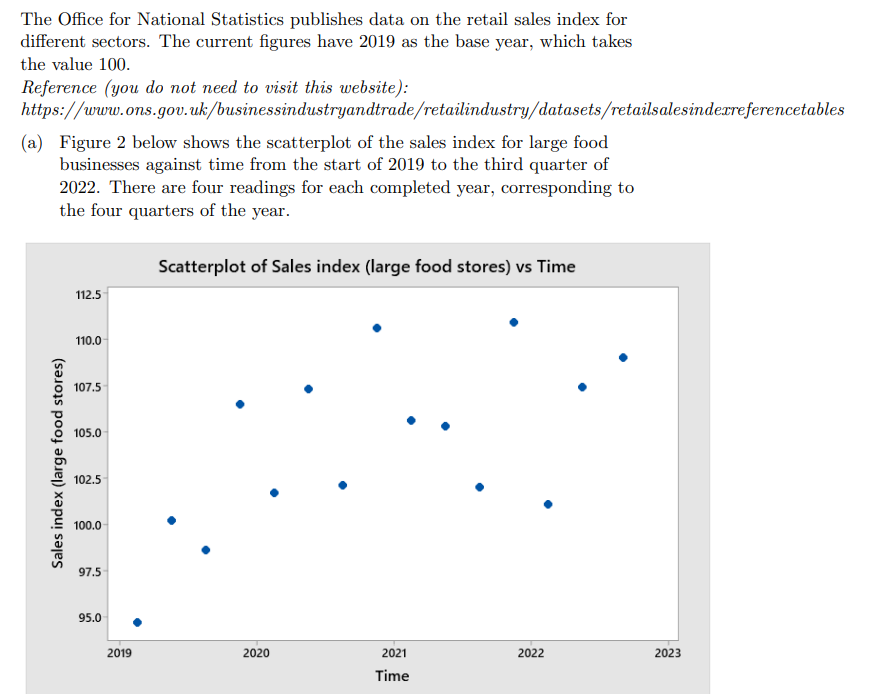
Question 1 [Unit 1] 7' marks A student is carrying out a biology project on trees. {a} They need to record three pieces of information about each tree: {i} The altitude at which it grows [compared to sea level] {ii} The height of the tree {iii} The height above the ground of the first branch from the trunk For one tree. they entered the data in the wrong columns in their table. The three data items recorded are. A: 12.1 metres 13: 800 metres C: 2.3 metres Match each piece of data with the appropriate feature of the tree. justifying your answer. {b} The student nds data from an earlier project which quotes the mean leaf length of this type of tree as 0.934155 cm. They feel this is not an appropriate level of accuracy. Round this measurement to an appropriate level of accuracy, justifying your answer. The word counts for the projects produced by this student and their immediate friends on the course are 4671. 5022. 4893, 5144. 4026. 5000, 5008. 4770' {i} Calculate by hand the median word count. Show your working. {ii} Calculate by hand the range of word counts. Show your working. Figure 1 Compare the new stemplot in Figure 1 with the default stemplot you obtained in part (a). (i) Describe any one difference between these two stemplots. (ii) Explain which stemplot provides the most useful information. Justify your answer. (c) Briefly describe the shape of the stemplot given in Figure 1 of part (b). Your answer should include whether the distribution is unimodal, bimodal or multimodal, whether it is left-skew, right-skew or symmetric and whether or not there are outliers. In each case, justify your answer.The Office for National Statistics publishes data on the retail sales index for different sectors. The current figures have 2019 as the base year, which takes the value 100. Reference (you do not need to visit this website): https://www.ons.gov.uk/businessindustryandtrade/retailindustry/datasets/retailsalesindexreferencetables (a) Figure 2 below shows the scatterplot of the sales index for large food businesses against time from the start of 2019 to the third quarter of 2022. There are four readings for each completed year, corresponding to the four quarters of the year. Scatterplot of Sales index (large food stores) vs Time 112.5 110.0 107.5 105.0 Sales index (large food stores) 102.5 100.0 97.5 95.0 2019 2020 2021 2022 2023 TimeFigure 2 Describe two features of the scatterplot. (b) Discuss with justification whether or not it would be appropriate to use a straight line to represent the data points on the scatterplot in Figure 2. If there are any time periods where you feel a straight line would be appropriate, state them, explaining your reasoning. (c) The Minitab worksheet smallfood.mwx contains the comparable data for small food businesses and has two columns. The column Time indicates the year and the quarter (for example, the time value for the first quarter in 2019 is 2019.125). The column Sales index (small food stores) gives the index value for that quarter. Produce a scatterplot of the index values against time. Include the plot in your answer. (d) Compare the scatterplots for the large and small food businesses.24 people in a local running club completed a \"Park Run\" and recorded their times. These are shown in the following stemplot Stem-and-Ieaf of Time (Minutes) N = 24 1 T3 El 2 T4 9 5 15 238 9 TE 2459 12 T? 24? 12 13 C11 353 T 19 433 4 20 L145 1 21 6 Leaf Unit = 111' Figure 3 {a} Calculate the {arithmetic} mean and the range of the times. Show all your working and round the mean to an appropriate level. {1)} Calculate the median, lower and upper quartiles of the times. Show all your working and round your answers to an appropriate level. {c} Use the mean, median and quartiles to comment on the skewness of the data, explaining your answer. A worker at a cat cafe notices there is quite a 1variation in the lengths of the cats' tails. She decides to record them and obtains the following boxplot Ca'ls' Tail Length (cm) * 1D 15 2D 25 3'] Tail Length [cm] Figure 4 [a] Explain what the asterisk (*} on the hoxplot represents. [1] [b] What can be deduced about the skewness of the data from the boxplot? Explain your answer. [2] [c] The worker realised she had missed out two cats. Their tail lengths were 241.1 cm and 24.6 cm. What impact would the inclusion of these two measurements have on the position and value of the median? Explain your answer [2]
Step by Step Solution
There are 3 Steps involved in it

Get step-by-step solutions from verified subject matter experts