

Question: Question: 1. Use Exhibit 1 and Exhibit2 to compute the NPV of the labor-intensive alternative and the capital-intensive alternative 2. How is capital budgeting done
Question:
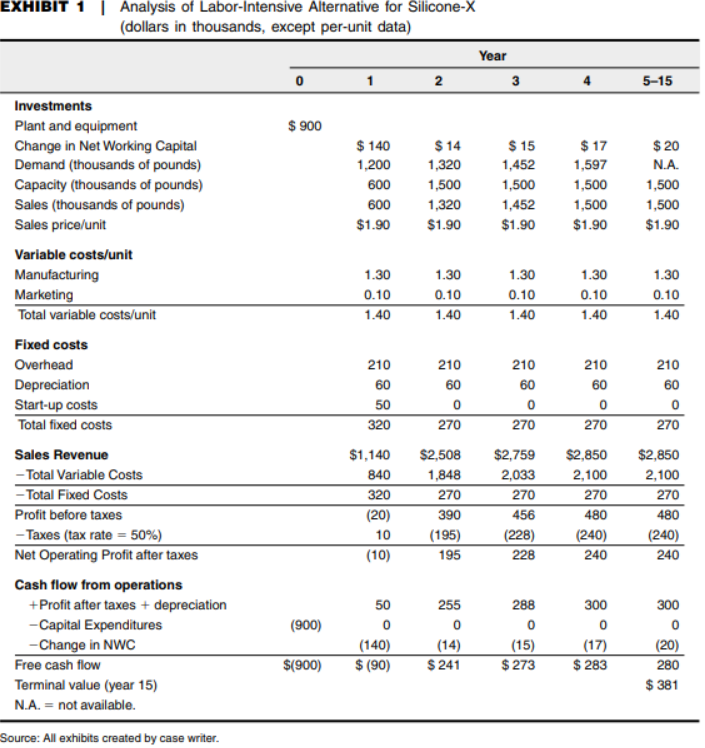
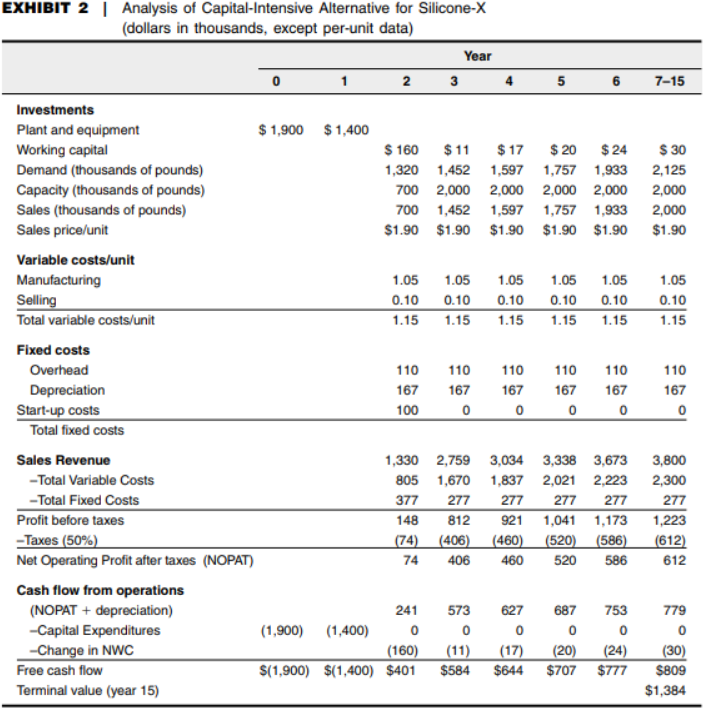
1. Use Exhibit 1 and Exhibit2 to compute the NPV of the labor-intensive alternative and the capital-intensive alternative
2. How is capital budgeting done at Jacobs ? Where do the projects come from ?
3. What are the discount rates used by Jacobs for 1) cost reduction, 2) new products, and 3) Reynolds. Is the use of multiple discount?
4. Evaluate the NPV versus Competitive Advantages of the proposed project. Should be project be selected ?
EXHIBITAnalysis of Labor-Intensive Alternative for Silicone-X dollars in thousands, except per-unit data) 5-15 Investments Plant and equipment Change in Net Working Capital Demand (thousands of pounds) Capacity (thousands of pounds) Sales (thousands of pounds) Sales price/unit Variable costs/unit $ 900 $140 $17 1,597 $ 20 N.A. 1,500 1,500 $1.90 1,200 1,320 1,452 600 ,500 500 1,452 $1.90 600 ,320 $1.90 1,500 $1.90 $1.90 1.30 0.10 1.40 1.30 1.30 0.10 1.40 1.30 1.30 Marketing Total variable costs/unit 1.40 1.40 1.40 Fixed costs 210 210 210 210 Depreciation Start-up costs Total fixed costs 60 270 270 270 270 Sales Revenue 1,140 $2,508 $2,759 $2,850 $2,850 Total Variable Costs 840 320 (20) 10 (10) 2,033 270 456 (228) 228 2,100 270 480 (240) 240 1,848 Total Fixed Costs Profit before taxes -Taxes (tax rate-50%) Net Operating Profit after taxes (195) 195 (240) 240 Cash flow from operations Profit after taxes depreciation 288 0 (15) $273 300 300 Capital Expenditures Change in NWC (900) Free cash flow Terminal value (year 15) N..-not available. (14) $(900) (90 $241 (17) $283 (20) 280 $381 Source: All exhibits created by case writer EXHIBITAnalysis of Labor-Intensive Alternative for Silicone-X dollars in thousands, except per-unit data) 5-15 Investments Plant and equipment Change in Net Working Capital Demand (thousands of pounds) Capacity (thousands of pounds) Sales (thousands of pounds) Sales price/unit Variable costs/unit $ 900 $140 $17 1,597 $ 20 N.A. 1,500 1,500 $1.90 1,200 1,320 1,452 600 ,500 500 1,452 $1.90 600 ,320 $1.90 1,500 $1.90 $1.90 1.30 0.10 1.40 1.30 1.30 0.10 1.40 1.30 1.30 Marketing Total variable costs/unit 1.40 1.40 1.40 Fixed costs 210 210 210 210 Depreciation Start-up costs Total fixed costs 60 270 270 270 270 Sales Revenue 1,140 $2,508 $2,759 $2,850 $2,850 Total Variable Costs 840 320 (20) 10 (10) 2,033 270 456 (228) 228 2,100 270 480 (240) 240 1,848 Total Fixed Costs Profit before taxes -Taxes (tax rate-50%) Net Operating Profit after taxes (195) 195 (240) 240 Cash flow from operations Profit after taxes depreciation 288 0 (15) $273 300 300 Capital Expenditures Change in NWC (900) Free cash flow Terminal value (year 15) N..-not available. (14) $(900) (90 $241 (17) $283 (20) 280 $381 Source: All exhibits created by case writer
Step by Step Solution
There are 3 Steps involved in it

Get step-by-step solutions from verified subject matter experts