

Question: Question #1 Use the accompanying data set to complete the following actions. a. Find the quartiles. b. Find the interquartile range. c. Identify any outliers.
Question #1
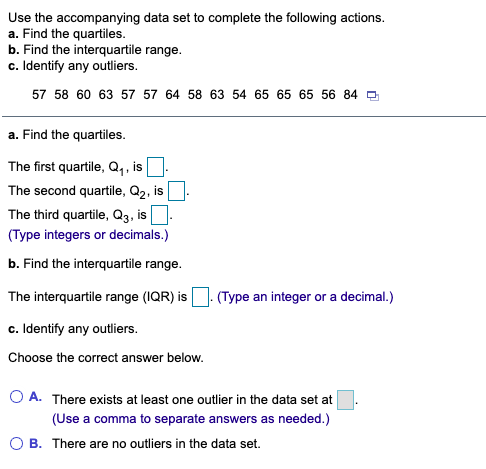
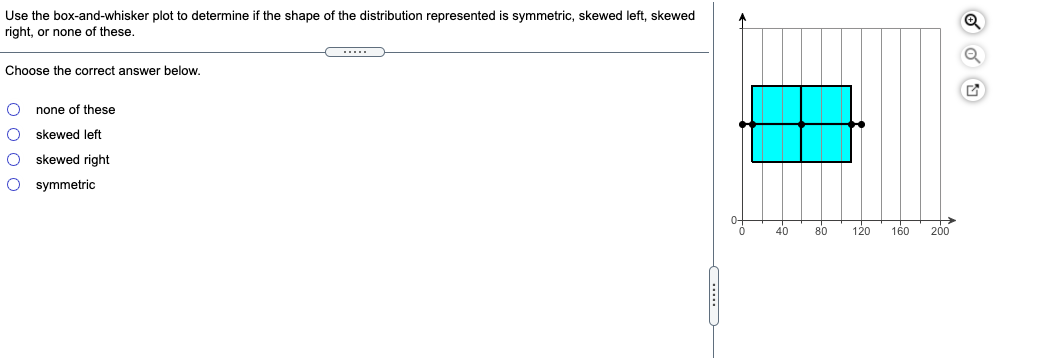
Use the accompanying data set to complete the following actions. a. Find the quartiles. b. Find the interquartile range. c. Identify any outliers. 57 58 60 63 57 57 64 58 63 54 65 65 65 56 84 0 a. Find the quartiles. The first quartile, Q , is The second quartile, Q2, is The third quartile, Q3, is (Type integers or decimals.) b. Find the interquartile range. The interquartile range (IQR) is . (Type an integer or a decimal.) c. Identify any outliers. Choose the correct answer below. O A. There exists at least one outlier in the data set at (Use a comma to separate answers as needed.) O B. There are no outliers in the data set.Use the box-and-whisker plot to determine if the shape of the distribution represented is symmetric, skewed left, skewed right, or none of these. Choose the correct answer below. O none of these O skewed left O skewed right O symmetric 40 80 120 160 200
Step by Step Solution
There are 3 Steps involved in it

Get step-by-step solutions from verified subject matter experts