

Question: QUESTION 1 Use the figure below to answer the following question. Price Price D1 D2 (a) Quantity (b) Quantity Price Price D1 D2 D2 (c)
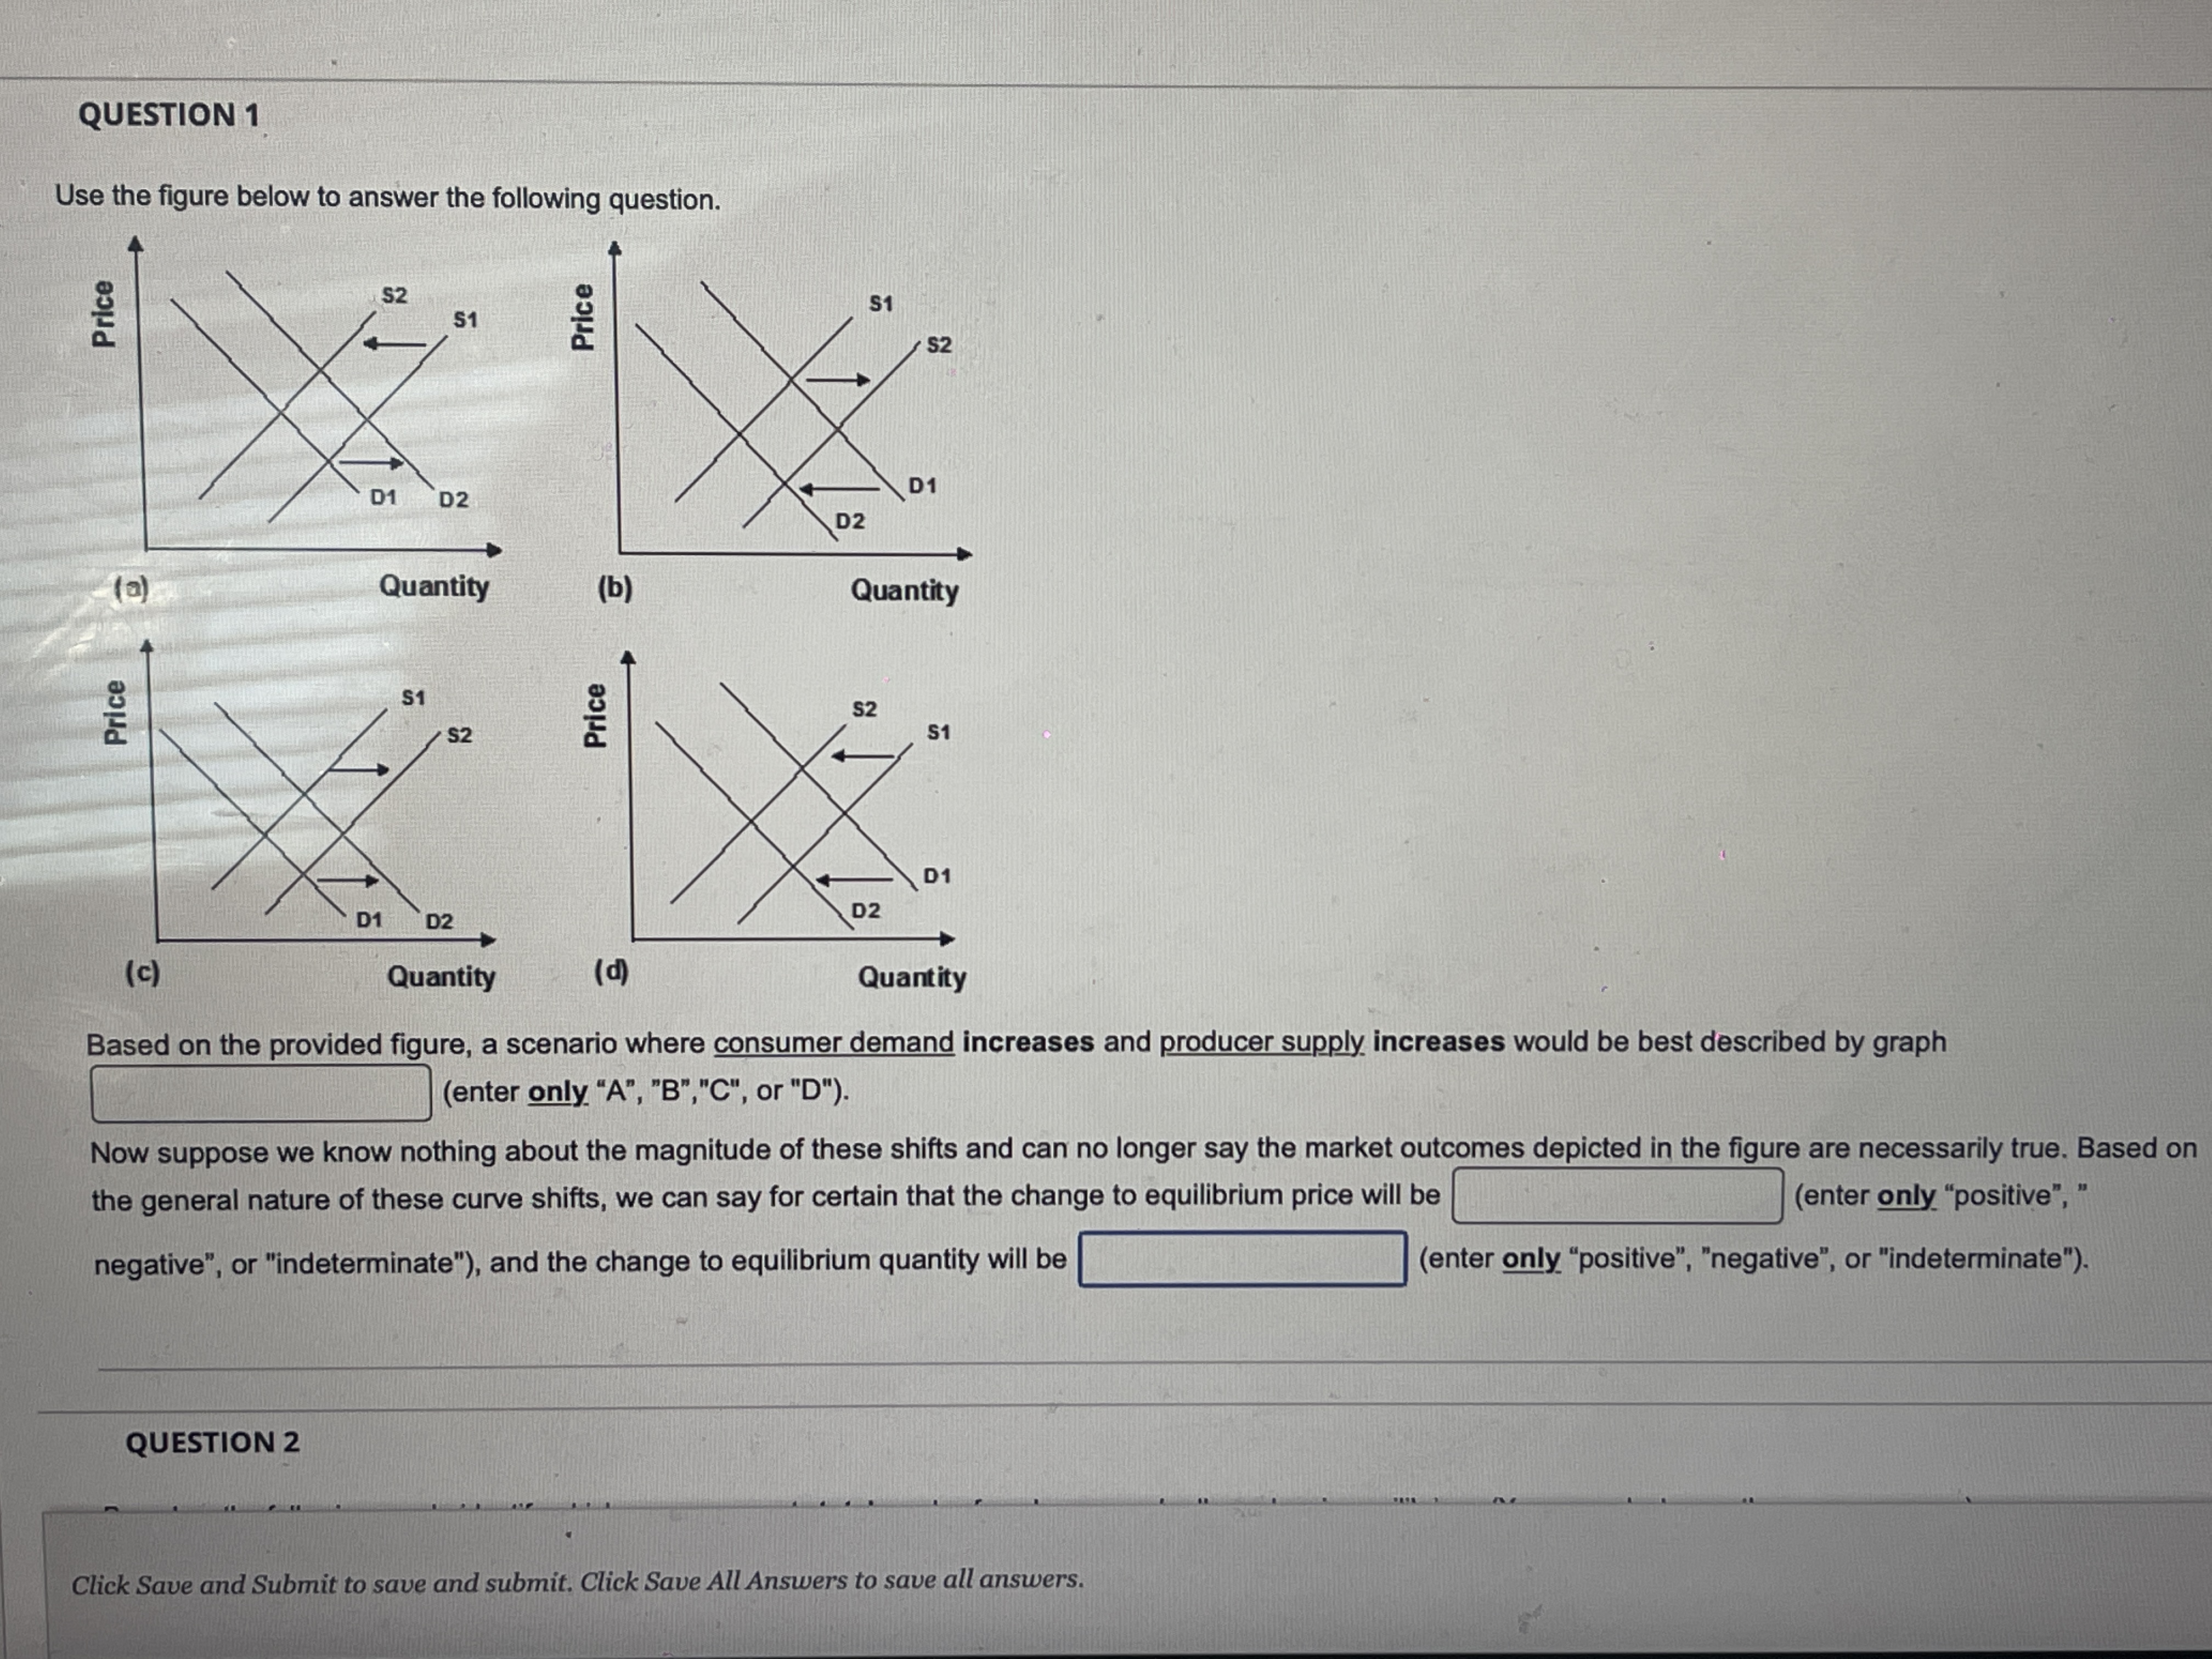

QUESTION 1 Use the figure below to answer the following question. Price Price D1 D2 (a) Quantity (b) Quantity Price Price D1 D2 D2 (c) Quantity (d) Quantity Based on the provided figure, a scenario where consumer demand increases and producer supply increases would be best described by graph (enter only "A", "B","C", or " D" ) . Now suppose we know nothing about the magnitude of these shifts and can no longer say the market outcomes depicted in the figure are necessarily true. Based on the general nature of these curve shifts, we can say for certain that the change to equilibrium price will be (enter only "positive"," negative", or "indeterminate"), and the change to equilibrium quantity will be (enter only "positive", "negative", or "indeterminate"). QUESTION 2 Click Save and Submit to save and submit. Click Save All Answers to save all answers
Step by Step Solution
There are 3 Steps involved in it

Get step-by-step solutions from verified subject matter experts