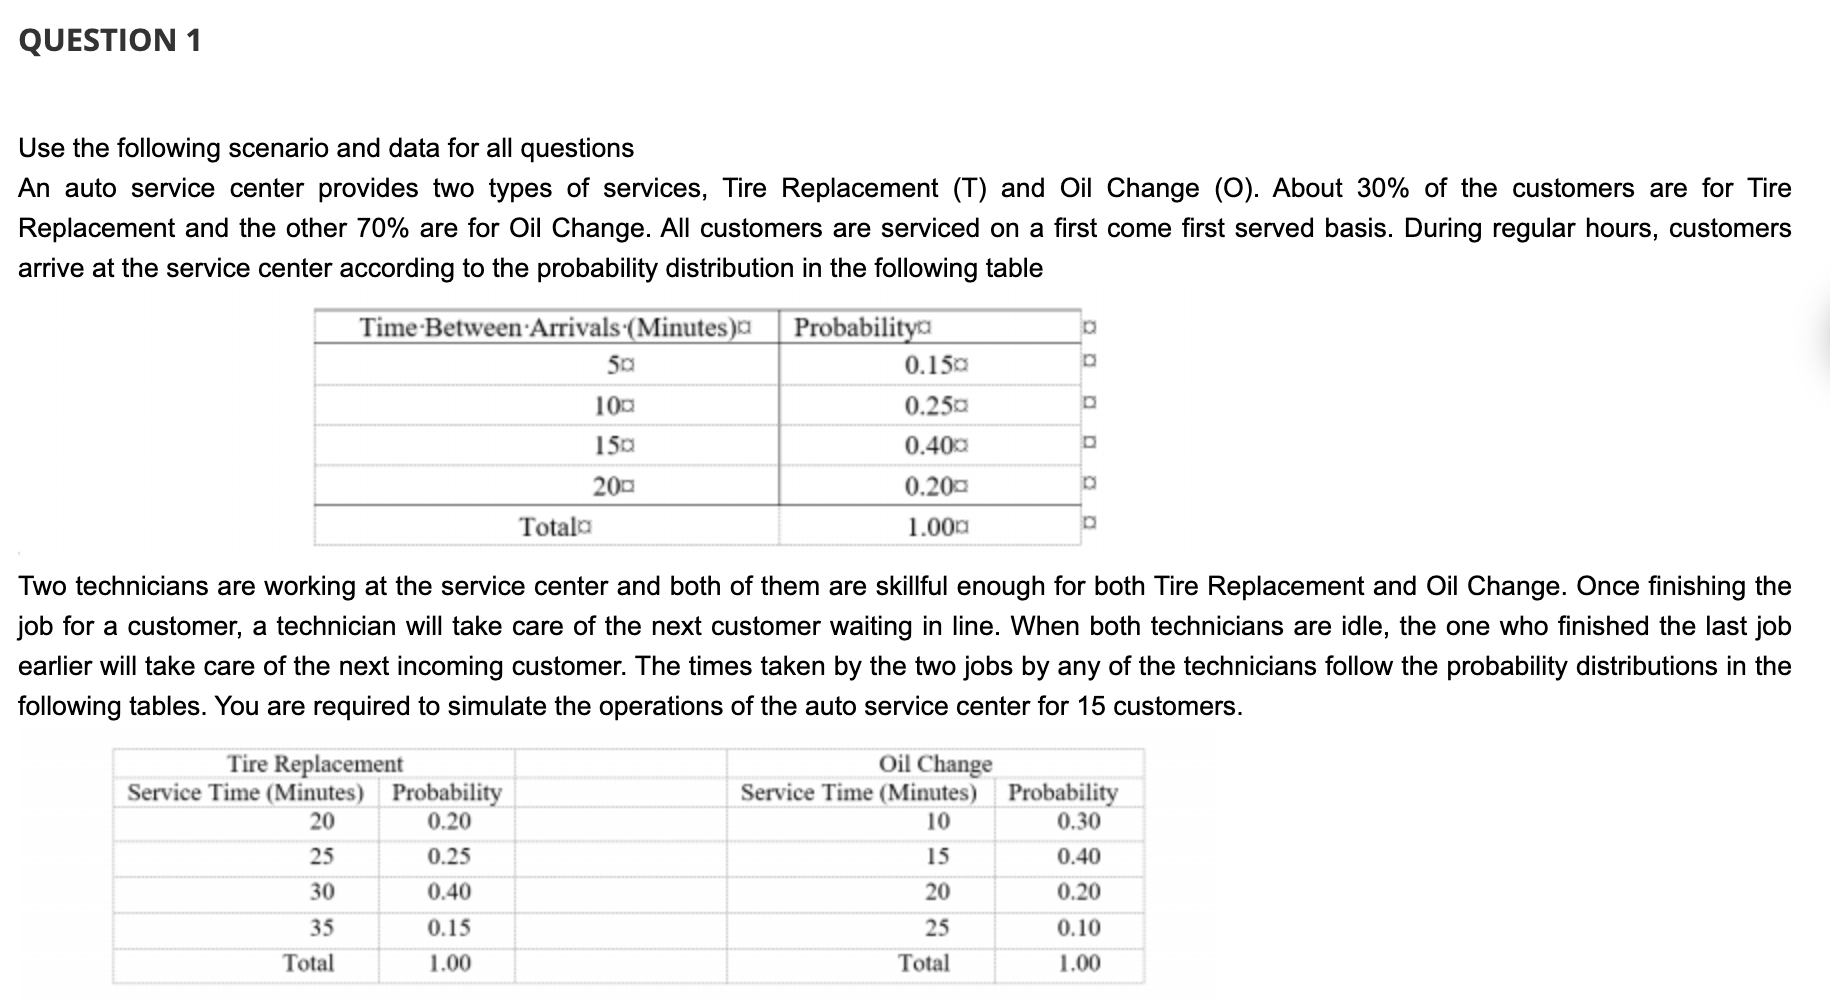
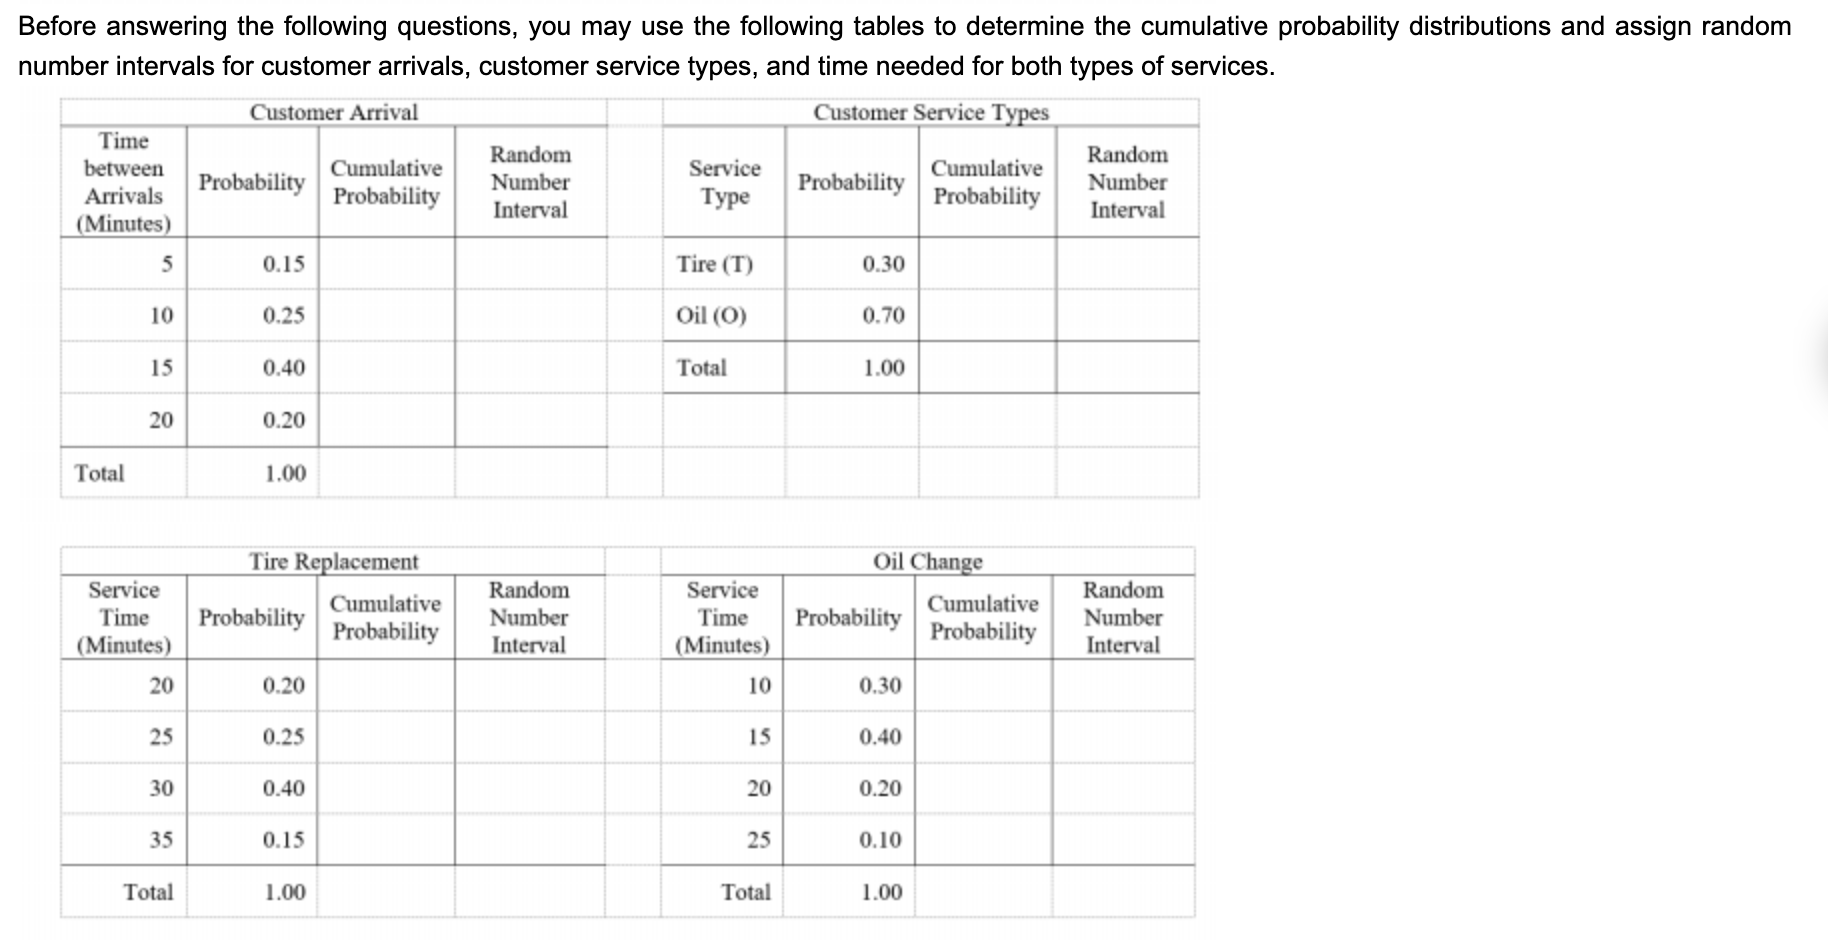
Question: QUESTION 1 Use the following scenario and data for all questions An auto service center provides two types of services, Tire Replacement (T) and Oil

QUESTION 1 Use the following scenario and dataQUESTION 1 Use the following scenario and dataQUESTION 1 Use the following scenario and dataQUESTION 1 Use the following scenario and data

QUESTION 1 Use the following scenario and data for all questions An auto service center provides two types of services, Tire Replacement (T) and Oil Change (O). About 30% of the customers are for Tire Replacement and the other 70% are for Oil Change. All customers are serviced on a first come first served basis. During regular hours, customers arrive at the service center according to the probability distribution in the following table Time Between Arrivals (Minutes) So Probabilitya 0.150 100 0.250 150 0.400 0.200 200 Totala 1.000 Two technicians are working at the service center and both of them are skillful enough for both Tire Replacement and Oil Change. Once finishing the job for a customer, a technician will take care of the next customer waiting in line. When both technicians are idle, the one who finished the last job earlier will take care of the next incoming customer. The times taken by the two jobs by any of the technicians follow the probability distributions in the following tables. You are required to simulate the operations of the auto service center for 15 customers. Oil Change Service Time (Minutes) Probability 10 0.30 20 Tire Replacement Service Time (Minutes) Probability 0.20 25 0.25 30 0.40 35 0.15 Total 1.00 15 0.40 0.20 20 25 0.10 1.00 Total Before answering the following questions, you may use the following tables to determine the cumulative probability distributions and assign random number intervals for customer arrivals, customer service types, and time needed for both types of services. Customer Arrival Customer Service Types Time Random Random between Cumulative Service Probability Number Cumulative Probability Number Arrivals Probability Interval Type Probability Interval (Minutes) 5 0.15 Tire (T) 0.30 10 0.25 Oil (O) 0.70 15 0.40 Total 1.00 20 0.20 Total 1.00 Service Time (Minutes) Tire Replacement Cumulative Probability Probability Random Number Interval Service Time (Minutes) 10 Oil Change Cumulative Probability Probability Random Number Interval 20 0.20 0.30 25 0.25 15 0.40 30 0.40 20 0.20 35 0.15 25 0.10 Total 1.00 Total 1.00 You may also simulate the operations of this auto service center for the 15 customers using the random numbers given in the following table. The "Start Time" is the time point when the job for the customer starts and the "Finish Time" is the time point when the job for the customer finishes. Start Finish Waiting Time Time Time (Minutes) 10 30 0 Random Time Service Customer Time Time of Random Random Between Number Needed Technician Number Amival Number Type Arrivals (Toro) ) Minutes) 10.1723 10 10 0.9237 0 0.7474 20 1 2 0.0042 5 5 150.3328 0 0.8679 20 2 2 3 0.2249 10 25 0.9420 0 0.3187 15 1 4 0.2060 10 35 0.3458 0 0.3067 15 2 15 35 0 30 45 5 35 50 0 5 0.2040 0.2180 0.1490 0.4262 0.5345 6 0.5578 7 0.4779 0.0285 0.5818 8 0.6022 0.5997 0.3836 9 0.3029 0.7520 0.4064 10 0.9998 0.7155 0.9079 11 0.1212 0.8780 0.6641 12 0.0613 0.2989 0.1922 13 0.2451 0.1682 0.4641 14 0.3375 0.9130 0.3814 15 0.3934 0.7647 0.1309 QUESTION 17 For customer 15, the service Start Time and Finish Time are, respectively, 180 and 195 175 and 190 175 and 185 165 and 180 None of the above QUESTION 18 On the average, a customer must wait for 10 minutes 5 minutes 9/5 minutes 10/3 minutes None of the above

Step by Step Solution

There are 3 Steps involved in it

1 Expert Approved Answer
Step: 1 Unlock blur-text-image
Question Has Been Solved by an Expert!

Get step-by-step solutions from verified subject matter experts

Step: 2 Unlock
Step: 3 Unlock

Students Have Also Explored These Related General Management Questions!