

Question: QUESTION 1 : Use the time series data in the Excel template file EXCEL PICTURE file to test three forecast techniques: 3 - period moving
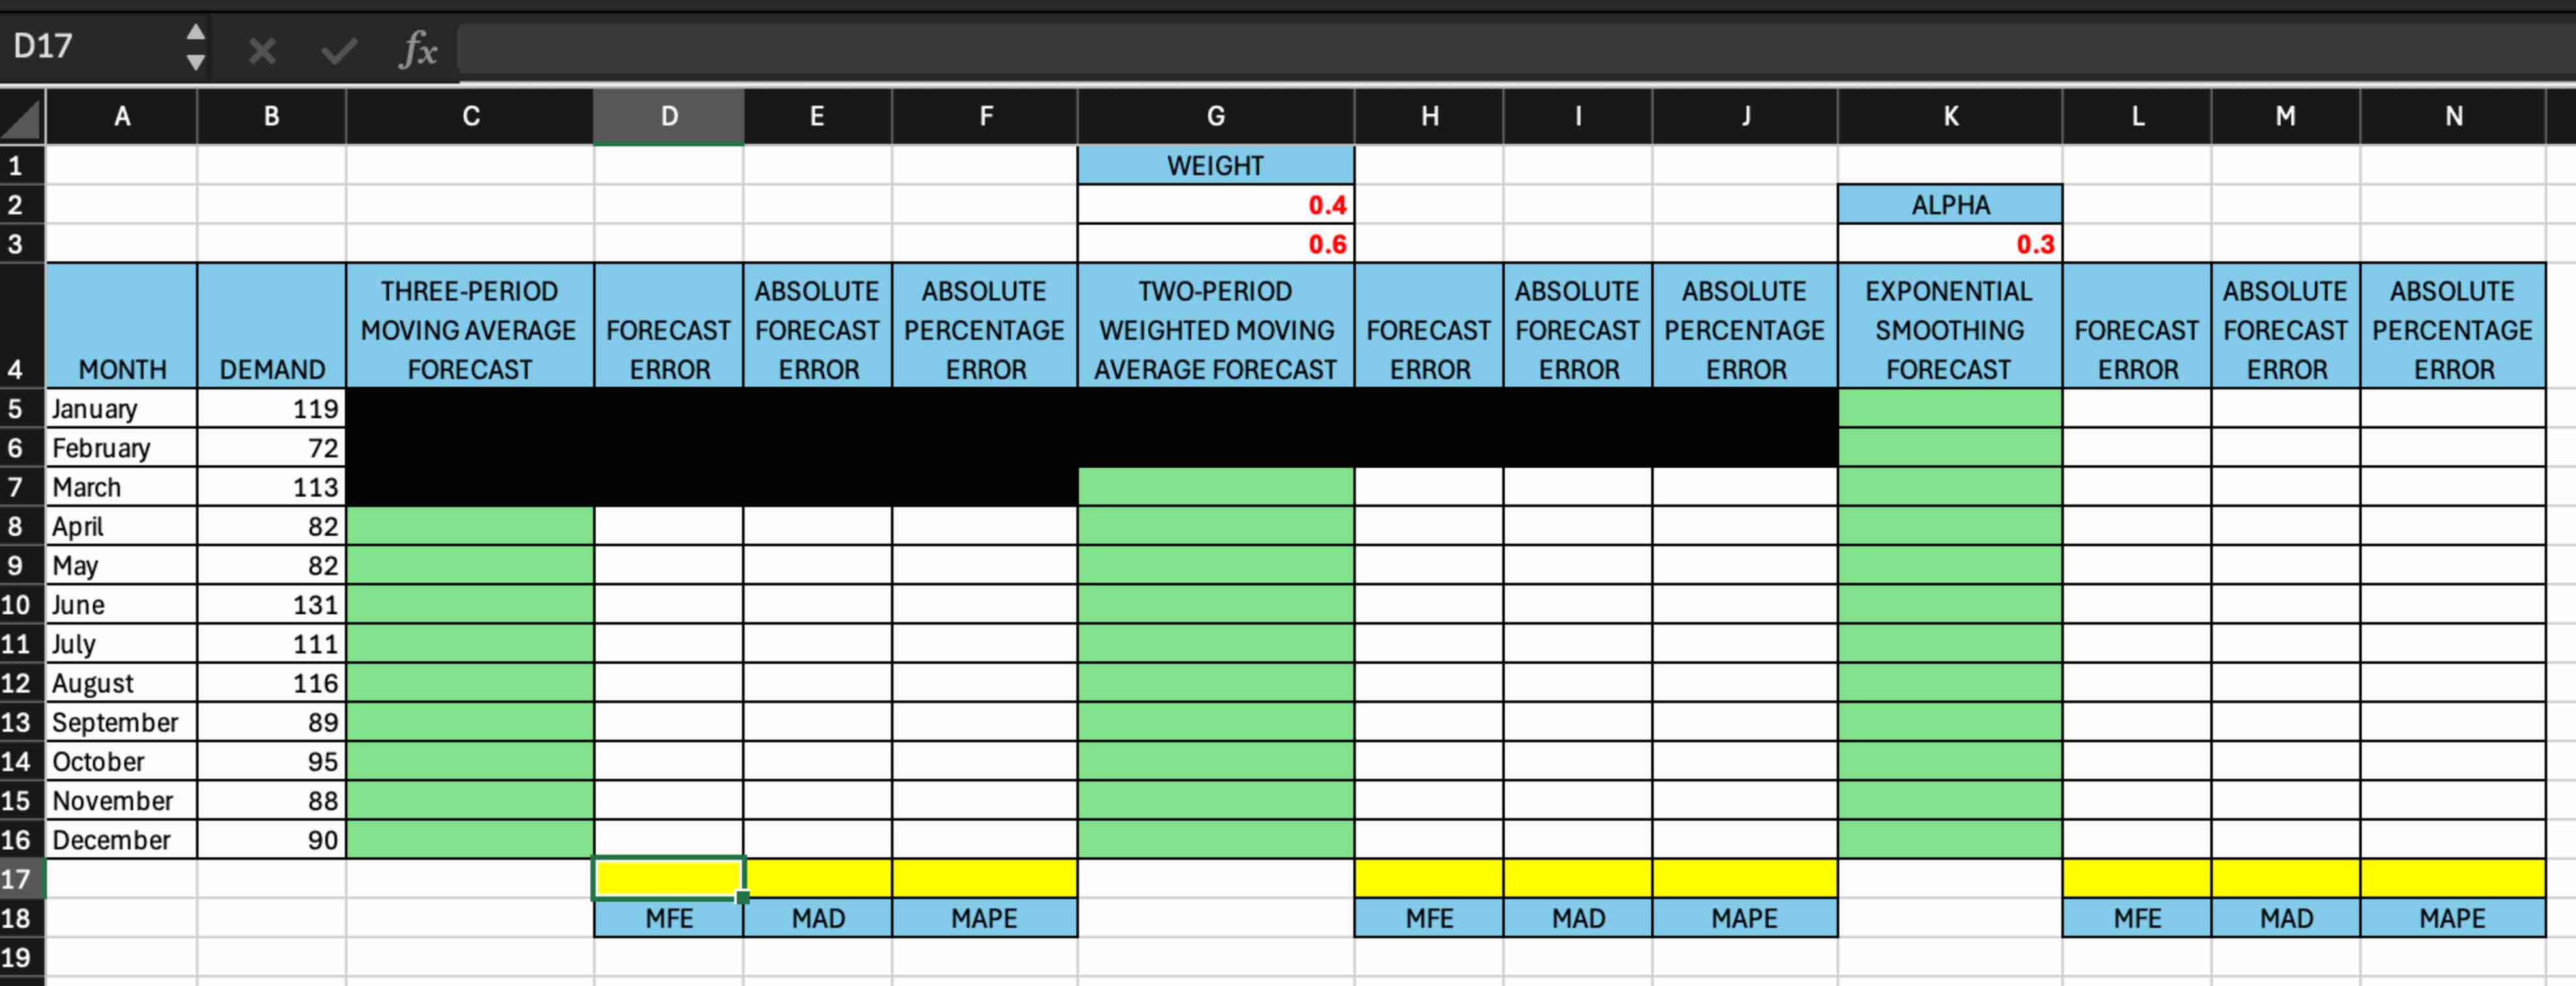
QUESTION : Use the time series data in the Excel template file EXCEL PICTURE file to test three forecast techniques: period moving average, period weighted moving average, and exponential smoothing. Calculate their MFE, MAD, and MAPE. Make sure to have all the cells configured with formulas. PLEASE SHOW ME WHAT FORMULA TO PUT IN EACH CELL AND ALSO SHOW ME THE RESULTS YOU GOT FROM YOUR END.
QUESTION : Which forecast technique is best for this time series data?
aperiod weighted moving average with weights and to period before and period before demands respectively.
bperiod moving averagE
c Exponential smoothing with
d Exponential smoothing with
QUESTION : Which forecast technique seems underforecasted demand?
aperiod weighted moving average with weights and to period before and period before demands respectively
bperiod moving average
c Exponential smoothing with
d Exponential smoothing with
QUESTION : Test exponential smoothing forecasts for According to MAPE, the generating the most accurate forecasts is type your answer... and the corresponding MAPE is Type your answer...keep digits after decimal point
Step by Step Solution
There are 3 Steps involved in it
1 Expert Approved Answer
Step: 1 Unlock

Question Has Been Solved by an Expert!
Get step-by-step solutions from verified subject matter experts
Step: 2 Unlock
Step: 3 Unlock