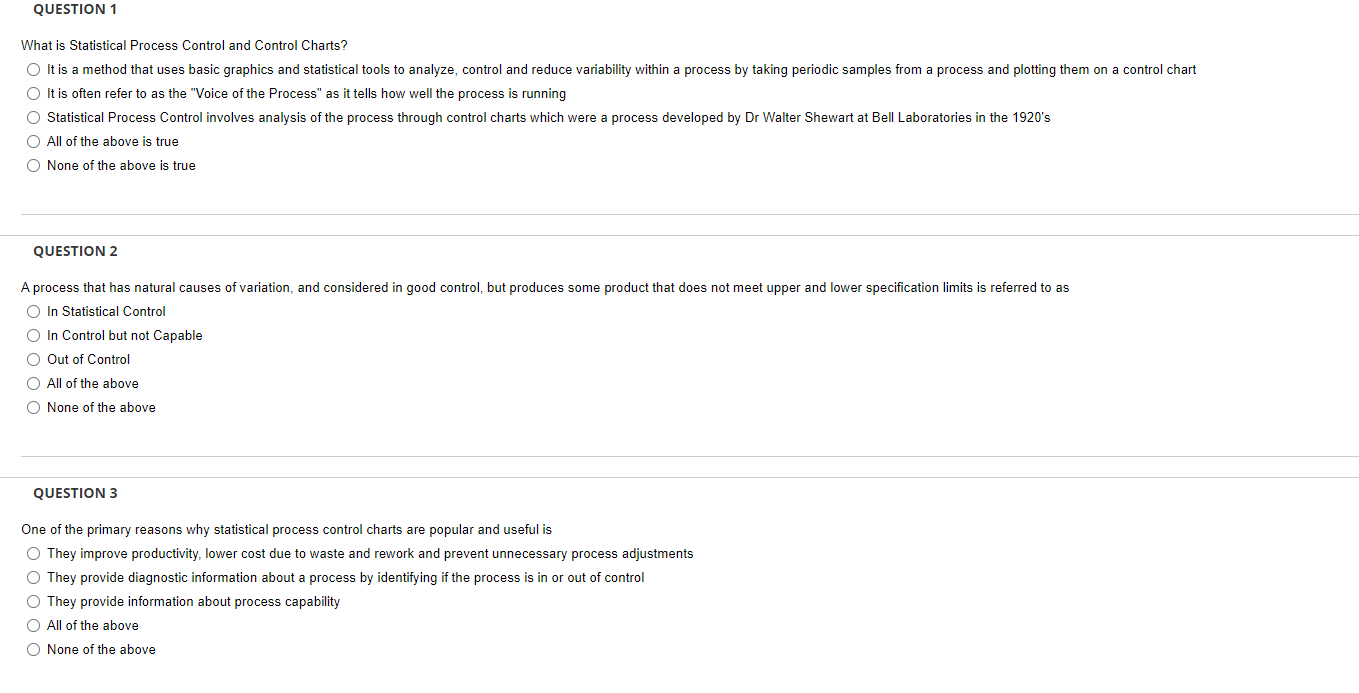
Question: QUESTION 1 What is Statistical Process Control and Control Charts? O It is a method that uses basic graphics and statistical tools to analyze, control

QUESTION 1 What is Statistical Process Control

QUESTION 1 What is Statistical Process Control and Control Charts? O It is a method that uses basic graphics and statistical tools to analyze, control and reduce variability within a process by taking periodic samples from a process and plotting them on a control chart O It is often refer to as the "Voice of the Process" as it tells how well the process is running O Statistical Process Control involves analysis of the process through control charts which were a process developed by Dr Walter Shewart at Bell Laboratories in the 1920's O All of the above is true O None of the above is true QUESTION 2 A process that has natural causes of variation, and considered in good control, but produces some product that does not meet upper and lower specification limits is referred to as O In Statistical Control O In Control but not Capable O Out of Control O All of the above O None of the above QUESTION 3 One of the primary reasons why statistical process control charts are popular and useful is O They improve productivity, lower cost due to waste and rework and prevent unnecessary process adjustments O They provide diagnostic information about a process by identifying if the process is in or out of control O They provide information about process capability O All of the above O None of the above

Step by Step Solution

There are 3 Steps involved in it

1 Expert Approved Answer
Step: 1 Unlock blur-text-image
Question Has Been Solved by an Expert!

Get step-by-step solutions from verified subject matter experts

Step: 2 Unlock
Step: 3 Unlock

Students Have Also Explored These Related General Management Questions!