

Question: Question 1: What is the conclusion for this hypothesis test at a 0.100.10 significance? level?A.RejectReject Upper H 0H0. There is insufficientinsufficient evidence to warrant rejection
Question 1: What is the conclusion for this hypothesis test at a 0.100.10 significance? level?A.RejectReject Upper H 0H0. There is insufficientinsufficient evidence to warrant rejection of the claim that the four different treatments yield the same mean poplar weight.B.Fail to rejectFailtoreject Upper H 0H0. There is insufficientinsufficient evidence to warrant rejection of the claim that the four different treatments yield the same mean poplar weight.C.RejectReject Upper H 0H0. There is sufficientsufficient evidence to warrant rejection of the claim that the four different treatments yield the same mean poplar weight.D.Fail to rejectFailtoreject Upper H 0H0. There is sufficientsufficient evidence to warrant rejection of the claim that the four different treatments yield the same mean poplar weight.Question 2: What do the displayed Bonferroni results tell? us?With a? P-value of ??enter your response here ?, there ?is notis a significant difference between the No Treatment and Fertilizer groups.With a? P-value of ??enter your response here ?, there ?isis not a significant difference between the No Treatment and Irrigation groups.With a? P-value of ??enter your response here ?, there ?isis not a significant difference between the No Treatment and Fertilizer and Irrigation groups.?(Round to three decimal places as? needed.)Let u1,u2,u3,u4 represent the mean amount of the no? treatment, fertilizer,? irrigation, and fertilizer and irrigation? groups, respectively. Use the Bonferroni test procedure with a 0.10 significance level to test for a significant difference between the mean amount of the irrigation treatment group and the group treated with both fertilizer and irrigation. Identify the test statistic and the? P-value. What do the results? indicate?Determine the null and alternative hypotheses.Upper H 0H0?: ?mu 3 equals mu 4?3=?4mu 3 not equals mu 4?3??4mu 1 equals mu 2?1=?2mu 1 not equals mu 2?1??2mu 2 equals mu 3?2=?3mu 2 not equals mu 3?2??3Upper H 1H1?: ?mu 1 equals mu 2?1=?2mu 2 not equals mu 3?2??3mu 3 equals mu 4?3=?4mu 3 not equals mu 4?3??4mu 1 not equals mu 2?1??2mu 2 equals mu 3?2=?3Part 7The test statistic is ??enter your response here .?(Round to two decimal places as? needed.)Find the? P-value.The? P-value is ??enter your response here .?(Round to three decimal places as? needed.)Part 9What do the results indicate at a 0.100.10 significance? level?A.Fail to rejectFailtoreject Upper H 0H0. There is insufficientinsufficient evidence to warrant rejection of the claim that the irrigation treatment group and the group treated with both fertilizer and irrigation yield the same mean poplar weight.B.Fail to rejectFailtoreject Upper H 0H0. There is sufficientsufficient evidence to warrant rejection of the claim that the irrigation treatment group and the group treated with both fertilizer and irrigation yield the same mean poplar weight.C.RejectReject Upper H 0H0. There is sufficientsufficient evidence to warrant rejection of the claim that the irrigation treatment group and the group treated with both fertilizer and irrigation yield the same mean poplar weight.D.RejectReject Upper H 0H0. There is insufficientinsufficient evidence to warrant rejection of the claim that the irrigation treatment group and the group treated with both fertilizer and irrigation yield the same mean poplar weight.
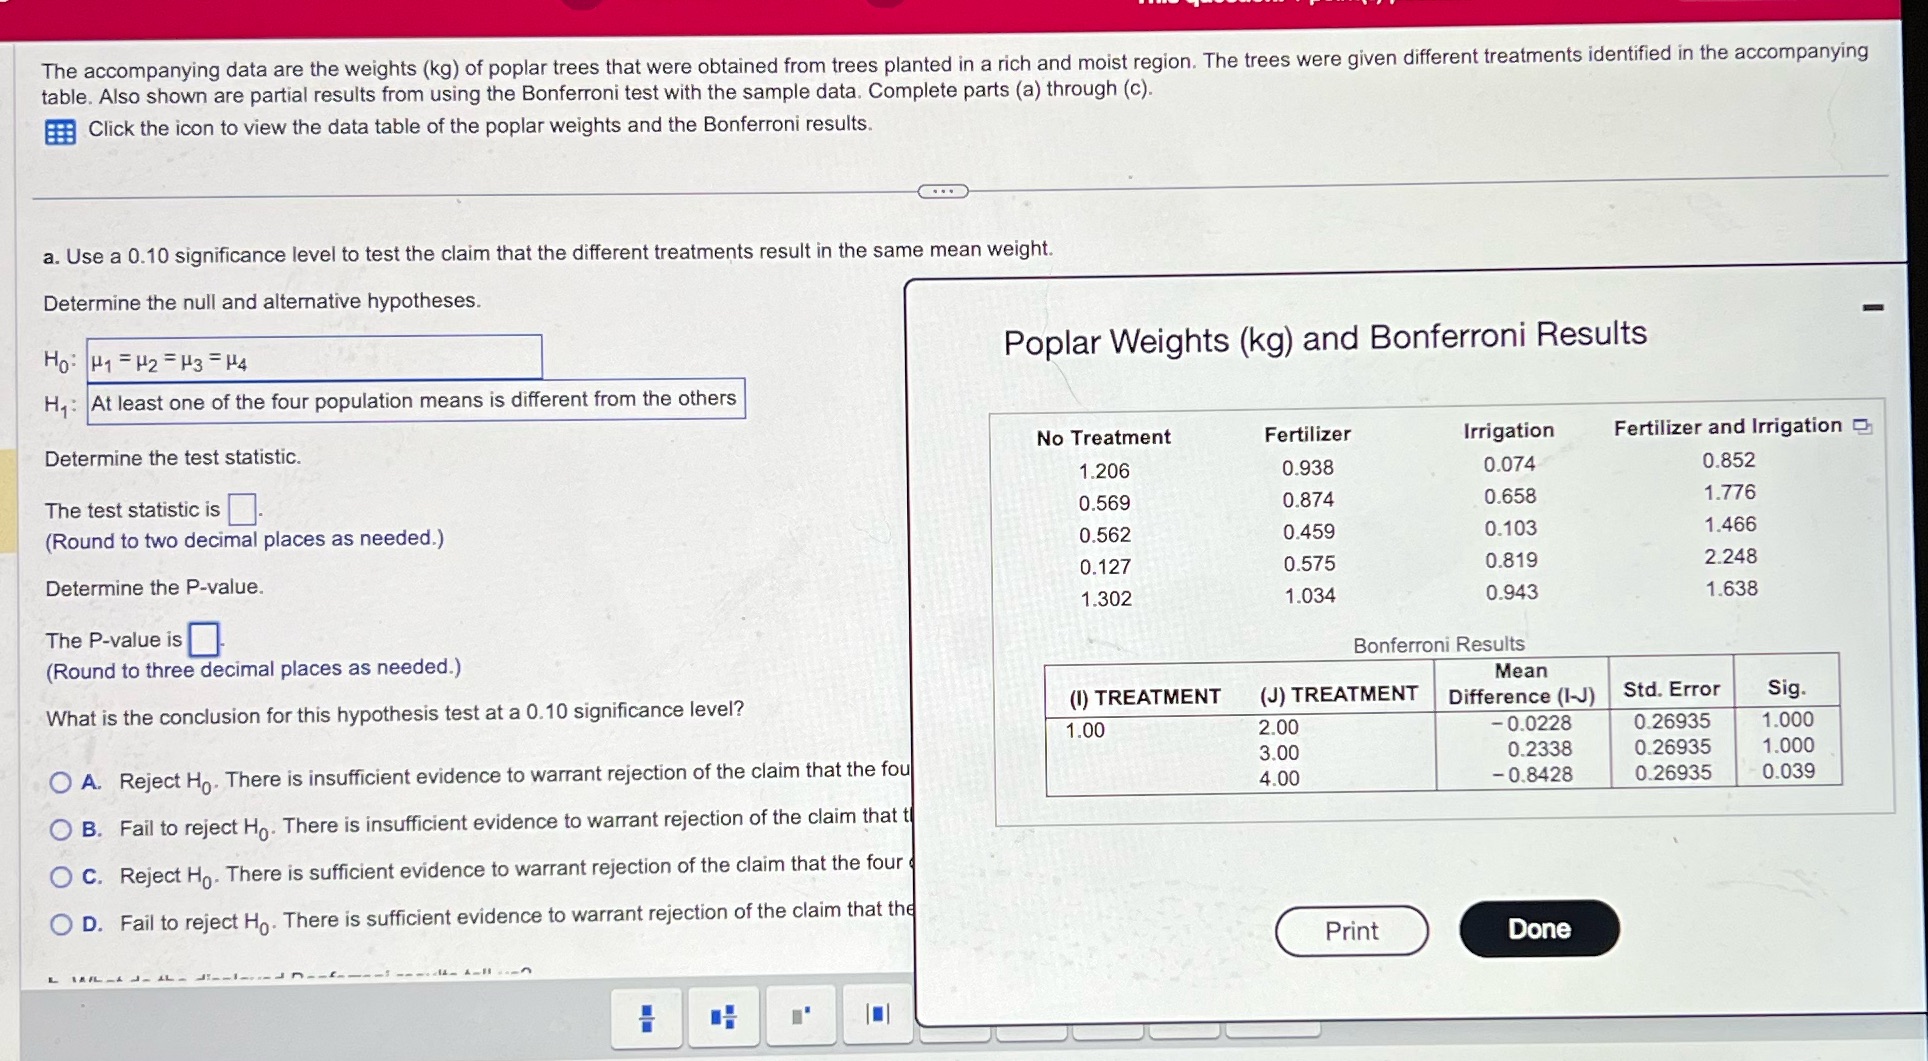
The accompanying data are the weights (kg) of poplar trees that were obtained from trees planted in a rich and moist region. The trees were given different treatments identified in the accompanying table. Also shown are partial results from using the Bonferroni test with the sample data. Complete parts (a) through (c). Click the icon to view the data table of the poplar weights and the Bonferroni results. a. Use a 0.10 significance level to test the claim that the different treatments result in the same mean weight. Determine the null and alternative hypotheses. Ho: H1 = H2 = H3 = H4 Poplar Weights (kg) and Bonferroni Results H: At least one of the four population means is different from the others Determine the test statistic. No Treatment Fertilizer Irrigation Fertilizer and Irrigation 1.206 0.938 0.074 0.852 The test statistic is. 0.569 0.874 0.658 1.776 (Round to two decimal places as needed.) 0.562 0.459 0.103 1.466 Determine the P-value. 0.127 0.575 0.819 2.248 1.302 1.034 0.943 1.638 The P-value is (Round to three decimal places as needed.) Bonferroni Results Mean What is the conclusion for this hypothesis test at a 0.10 significance level? (1) TREATMENT (J) TREATMENT Difference (I-J) Std. Error Sig 1.00 2.00 -0.0228 0.26935 1.000 O A. Reject Ho. There is insufficient evidence to warrant rejection of the claim that the foul 3.00 0.2338 0.26935 1.000 4.00 -0.8428 0.26935 0.039 O B. Fail to reject Ho. There is insufficient evidence to warrant rejection of the claim that t O C. Reject Ho. There is sufficient evidence to warrant rejection of the claim that the four O D. Fail to reject Ho. There is sufficient evidence to warrant rejection of the claim that the Print Done
Step by Step Solution
There are 3 Steps involved in it

Get step-by-step solutions from verified subject matter experts