

Question: Question 1 Which best describes the difference between a histogram and a bar chart? 5 pts A histogram has categories on the x-axis. A
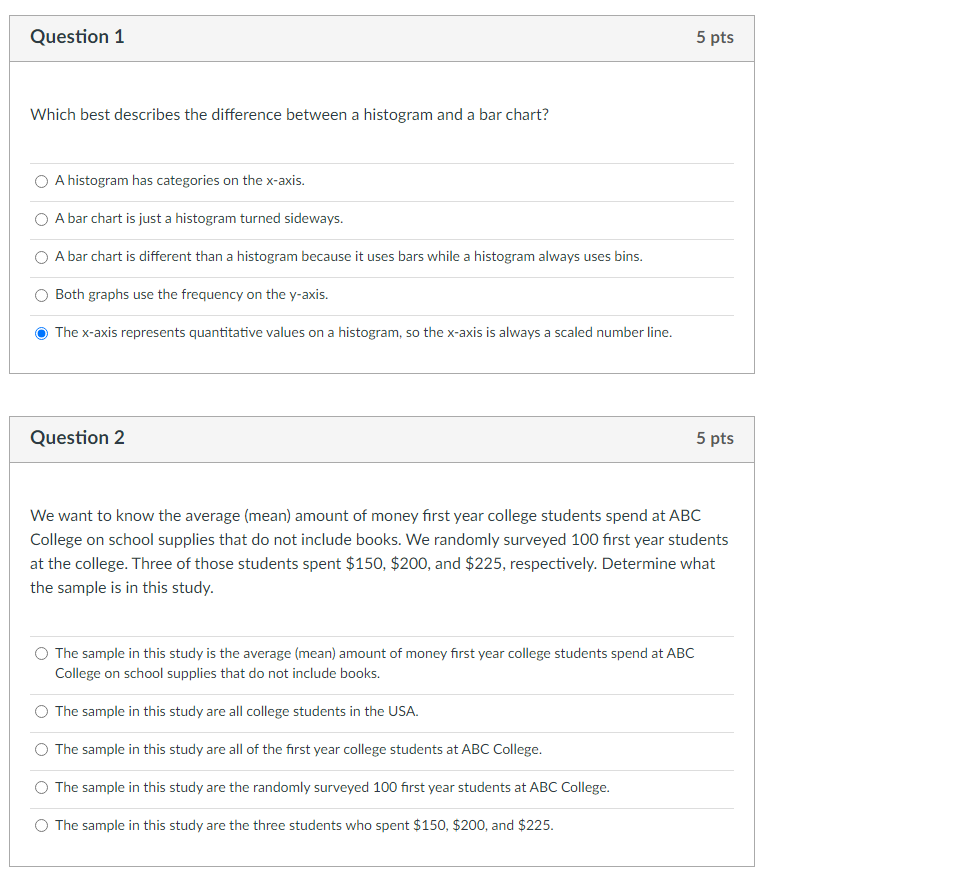
Question 1 Which best describes the difference between a histogram and a bar chart? 5 pts A histogram has categories on the x-axis. A bar chart is just a histogram turned sideways. A bar chart is different than a histogram because it uses bars while a histogram always uses bins. Both graphs use the frequency on the y-axis. The x-axis represents quantitative values on a histogram, so the x-axis is always a scaled number line. Question 2 5 pts We want to know the average (mean) amount of money first year college students spend at ABC College on school supplies that do not include books. We randomly surveyed 100 first year students at the college. Three of those students spent $150, $200, and $225, respectively. Determine what the sample is in this study. The sample in this study is the average (mean) amount of money first year college students spend at ABC College on school supplies that do not include books. The sample in this study are all college students in the USA. The sample in this study are all of the first year college students at ABC College. The sample in this study are the randomly surveyed 100 first year students at ABC College. 000 The sample in this study are the three students who spent $150, $200, and $225.
Step by Step Solution
There are 3 Steps involved in it

Get step-by-step solutions from verified subject matter experts