

Question: Question 1 with graph - Sales Forecasting Homework Descriptions: Suppose that we are building the home improvement store (e.g. Home Depot like store) at Mexico
Question 1 with graph
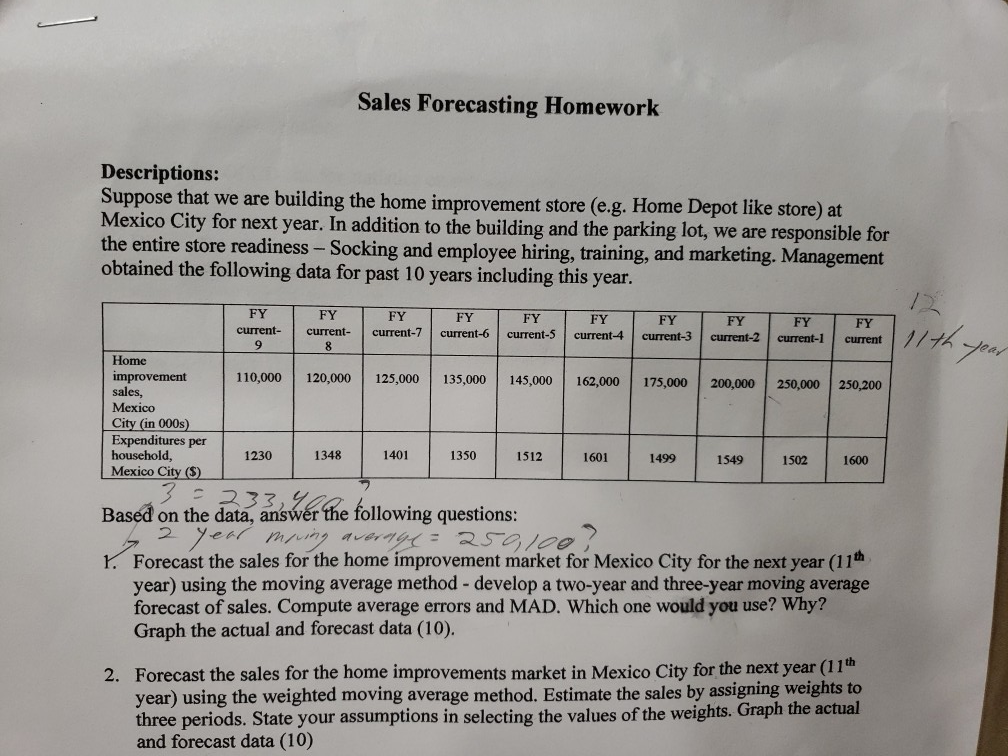
- Sales Forecasting Homework Descriptions: Suppose that we are building the home improvement store (e.g. Home Depot like store) at Mexico City for next year. In addition to the building and the parking lot, we are responsible for the entire store readiness - Socking and employee hiring, training, and marketing. Management obtained the following data for past 10 years including this year. FY current- 9 FY current- FY current-7 FY current-6 FY current-5 FY current-4 FY current-3 FY current-2 FY current-1 FY current 11th. 120,000 125,000 135,000 145,000 162,000 175.000 200,000 1230 1348 1401 1350 1512 1601 1499 1549 1502 1600 Home improvement 110,000 250,000 250,200 sales, Mexico City (in 000s) Expenditures per household, Mexico City ($) Based on the data, answer the following questions: data. answer the 2 year mping average 259100? 1. Forecast the sales for the home improvement market for Mexico City for the next year (11th year) using the moving average method - develop a two-year and three-year moving average forecast of sales. Compute average errors and MAD. Which one would you use? Why? Graph the actual and forecast data (10). 2. Forecast the sales for the home improvements market in Mexico City for the next year (11th year) using the weighted moving average method. Estimate the sales by assigning weights to three periods. State your assumptions in selecting the values of the weights. Graph the actual and forecast dataStep by Step Solution
There are 3 Steps involved in it
1 Expert Approved Answer
Step: 1 Unlock

Question Has Been Solved by an Expert!
Get step-by-step solutions from verified subject matter experts
Step: 2 Unlock
Step: 3 Unlock