

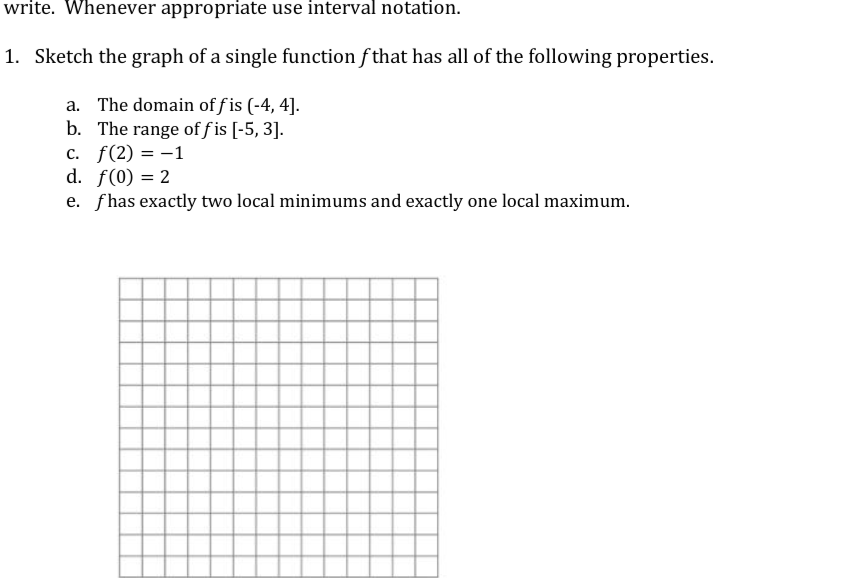
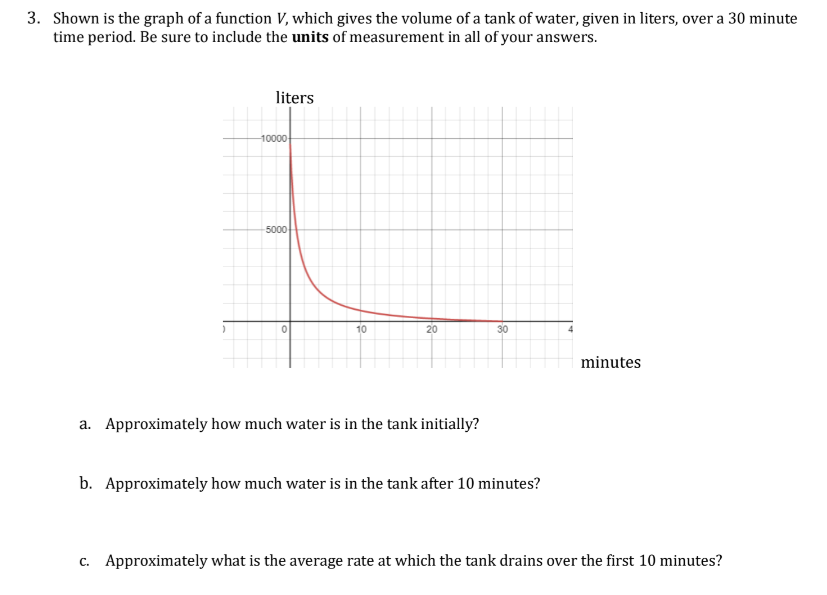
Question: Question 1- write. Whenever appropriate use interval notation. 1. Sketch the graph of a single function f that has all of the following properties. a.

![properties. a. The domain of f is [-4, 4]. b. The range](https://s3.amazonaws.com/si.experts.images/answers/2024/06/6666434202ac6_92166664341c4f8e.jpg)
![of f is [-5, 3]. C. f(2) = -1 d. f0?) =](https://s3.amazonaws.com/si.experts.images/answers/2024/06/6666434253ba4_922666643424005c.jpg)
![(these are y-values], and where they occur [this is an x-values]: iv.](https://s3.amazonaws.com/si.experts.images/answers/2024/06/6666434394fdf_9236666434384c0a.jpg)


Question 1-


write. Whenever appropriate use interval notation. 1. Sketch the graph of a single function f that has all of the following properties. a. The domain of f is [-4, 4]. b. The range of f is [-5, 3]. C. f(2) = -1 d. f0?) = 2 e. f has exactlyr two local minimums and exactly one local maximum. For the function you have graphed above, estimate the following: i. Intervals of increase: ii. Intervals of decrease: iii. The local minimum values (these are y-values], and where they occur [this is an x-values]: iv. The local maximum Value, and where it occurs: \fg. All solutions to (x-values where) f(x) = g(x). Assume both graphs have domains of (-00, co). h. All solutions to (x-values where) f(x)
Step by Step Solution
There are 3 Steps involved in it

Get step-by-step solutions from verified subject matter experts