

Question: Question 1: Your construction company worked on the projects shown in the table below during the last year. The duration shown in the table represents
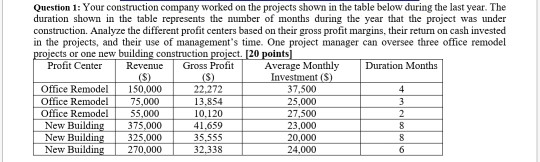
Question 1: Your construction company worked on the projects shown in the table below during the last year. The duration shown in the table represents the number of months during the year that the project was under construction. Analyze the different profit centers based on their gross profit margins, their return on cash invested in the projects, and their use of management's time. One project manager can oversee three office remodel projects or one new building construction project. 20 points) Profit Center Revenue Gross Profit Avenge Monthly Duration Months (S) (S) Investment (S) Office Remodel 150.000 22.272 37.500 Office Remodel 75,000 13.854 25,000 Office Remodel 35.000 10.120 27,500 New Building 375.000 41.659 23,000 New Building 325,000 35.555 20,000 New Building 270.000 32.338 24,000
Step by Step Solution
There are 3 Steps involved in it

Get step-by-step solutions from verified subject matter experts