

Question: Question 10 0 / 1 point The table below shows the summary for weights of 6 people before a diet program and after. The weight
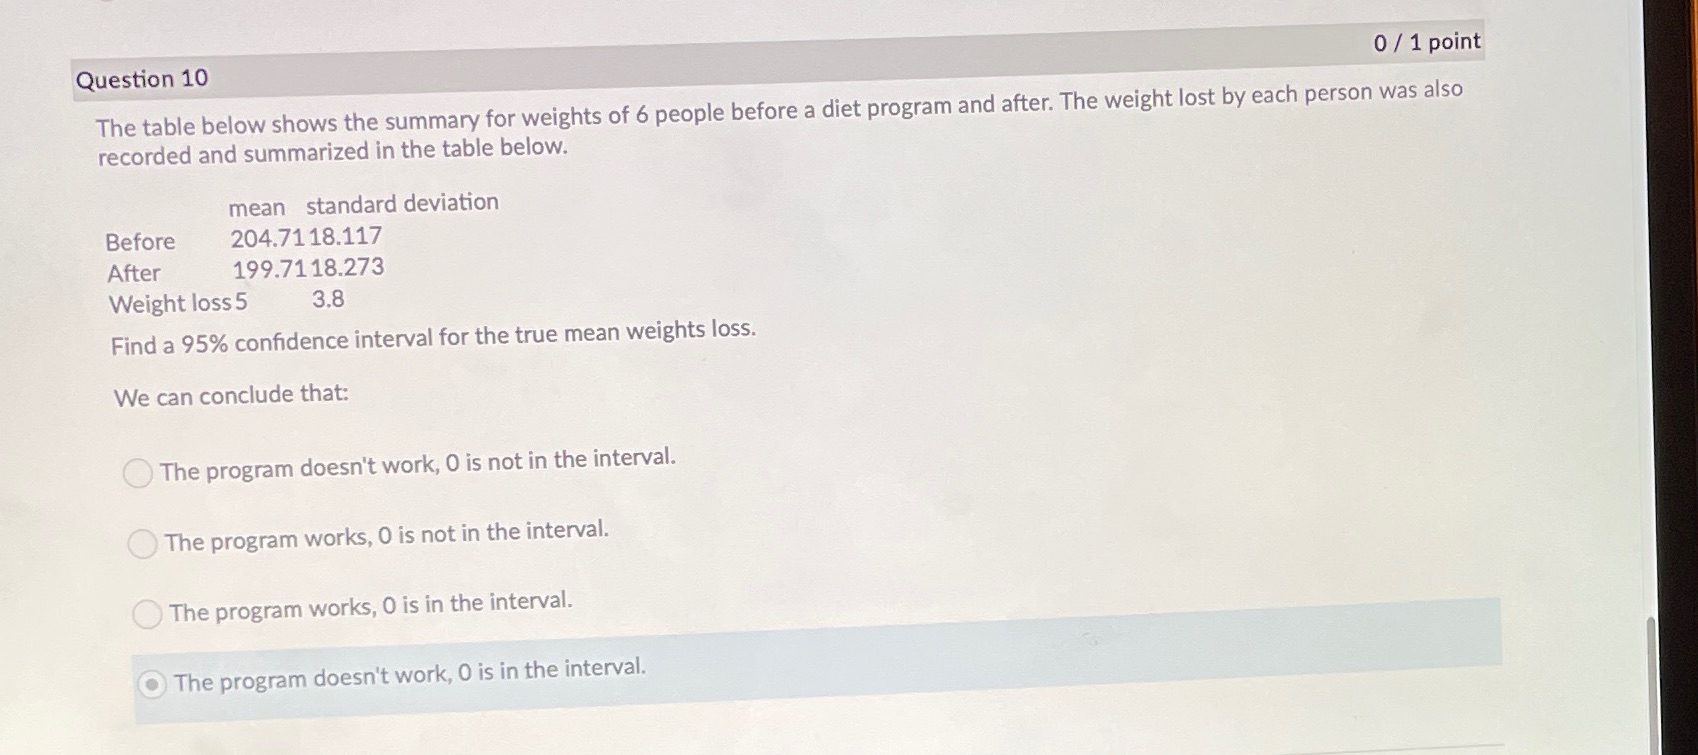
Question 10 0 / 1 point The table below shows the summary for weights of 6 people before a diet program and after. The weight lost by each person was also recorded and summarized in the table below. mean standard deviation Before 204.71 18.117 After 199.71 18.273 Weight loss 5 3.8 Find a 95% confidence interval for the true mean weights loss. We can conclude that: The program doesn't work, 0 is not in the interval. The program works, 0 is not in the interval. The program works, 0 is in the interval. The program doesn't work, 0 is in the interval
Step by Step Solution
There are 3 Steps involved in it
1 Expert Approved Answer
Step: 1 Unlock

Question Has Been Solved by an Expert!
Get step-by-step solutions from verified subject matter experts
Step: 2 Unlock
Step: 3 Unlock