

Question: Question 10 1 points Save Answer In your R console, type in the following code: > plot(cars$dist-cars$speed, ylab = Braking Distances, in Feet) Which of
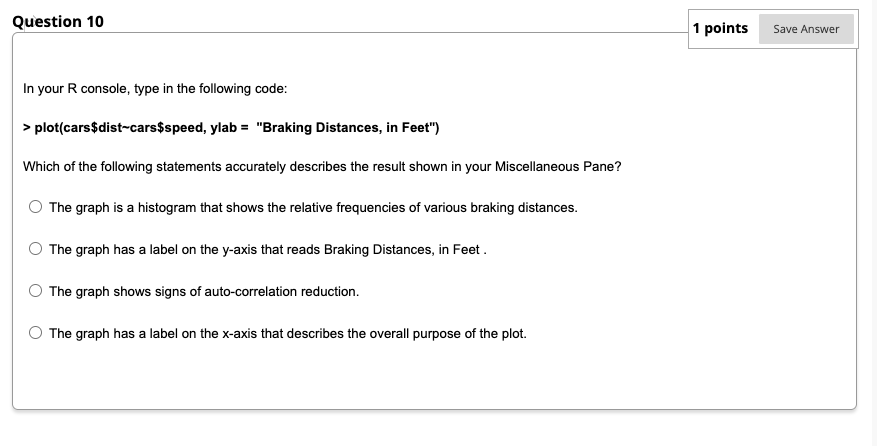
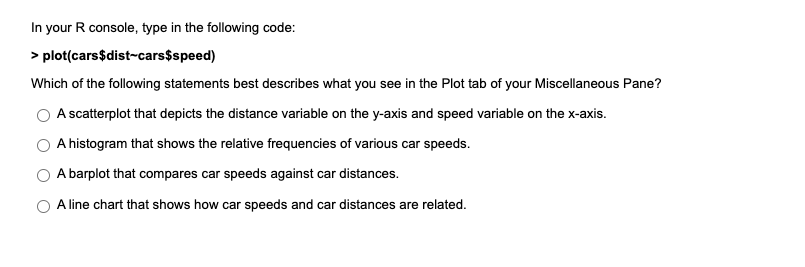
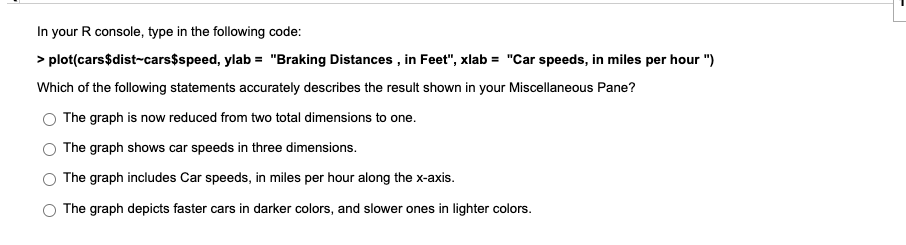
Question 10 1 points Save Answer In your R console, type in the following code: > plot(cars$dist-cars$speed, ylab = "Braking Distances, in Feet") Which of the following statements accurately describes the result shown in your Miscellaneous Pane? The graph is a histogram that shows the relative frequencies of various braking distances. The graph has a label on the y-axis that reads Braking Distances, in Feet. The graph shows signs of auto-correlation reduction. The graph has a label on the x-axis that describes the overall purpose of the plot. In your R console, type in the following code: > plot(cars$dist-cars$speed) Which of the following statements best describes what you see in the Plot tab of your Miscellaneous Pane? A scatterplot that depicts the distance variable on the y-axis and speed variable on the x-axis. A histogram that shows the relative frequencies of various car speeds. A barplot that compares car speeds against car distances. A line chart that shows how car speeds and car distances are related. In your R console, type in the following code: > plot(cars $dist-cars$speed, ylab = "Braking Distances , in Feet", xlab = "Car speeds, in miles per hour") Which of the following statements accurately describes the result shown in your Miscellaneous Pane? The graph is now reduced from two total dimensions to one. The graph shows car speeds in three dimensions. The graph includes Car speeds, in miles per hour along the x-axis. The graph depicts faster cars in darker colors, and slower ones in lighter colors. Question 10 1 points Save Answer In your R console, type in the following code: > plot(cars$dist-cars$speed, ylab = "Braking Distances, in Feet") Which of the following statements accurately describes the result shown in your Miscellaneous Pane? The graph is a histogram that shows the relative frequencies of various braking distances. The graph has a label on the y-axis that reads Braking Distances, in Feet. The graph shows signs of auto-correlation reduction. The graph has a label on the x-axis that describes the overall purpose of the plot. In your R console, type in the following code: > plot(cars$dist-cars$speed) Which of the following statements best describes what you see in the Plot tab of your Miscellaneous Pane? A scatterplot that depicts the distance variable on the y-axis and speed variable on the x-axis. A histogram that shows the relative frequencies of various car speeds. A barplot that compares car speeds against car distances. A line chart that shows how car speeds and car distances are related. In your R console, type in the following code: > plot(cars $dist-cars$speed, ylab = "Braking Distances , in Feet", xlab = "Car speeds, in miles per hour") Which of the following statements accurately describes the result shown in your Miscellaneous Pane? The graph is now reduced from two total dimensions to one. The graph shows car speeds in three dimensions. The graph includes Car speeds, in miles per hour along the x-axis. The graph depicts faster cars in darker colors, and slower ones in lighter colors
Step by Step Solution
There are 3 Steps involved in it

Get step-by-step solutions from verified subject matter experts