Question: QUESTION 10 Given a Davis County elderly population increase of 6.3% (based on 2016), and an elderly discharge rate increase of 2.1% (2016), how many
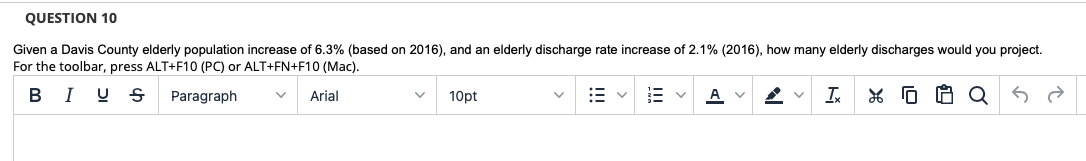
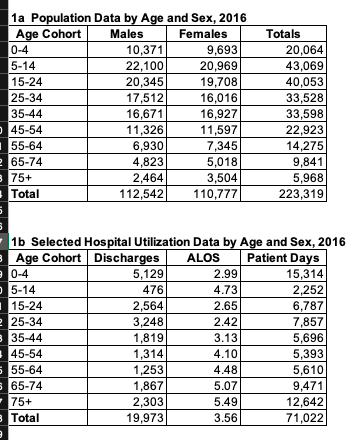
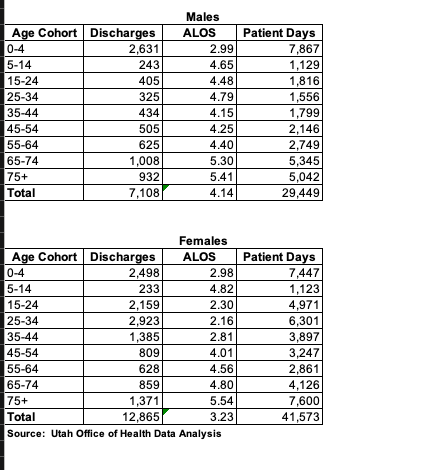
QUESTION 10 Given a Davis County elderly population increase of 6.3% (based on 2016), and an elderly discharge rate increase of 2.1% (2016), how many elderly discharges would you project. For the toolbar, press ALT+F10 (PC) or ALT+FN+F10 (Mac). B I U Paragraph Arial 10pt A 4o T. V 1a Population Data by Age and Sex, 2016 Age Cohort Males Females Totals 0-4 10,371 9,693 20,064 5-14 22,100 20,969 43,069 15-24 20,345 19,708 40,053 25-34 17,512 16,016 33,528 35-44 16,671 16,927 33,598 45-54 11,326 11,597 22,923 155-64 6,930 7,345 14,275 265-74 4,823 5,018 9,841 75+ 2,464 3,504 5,968 Total 112,542 110,777 223,319 5 3 1b Selected Hospital Utilization Data by Age and Sex, 2016 Age Cohort Discharges ALOS Patient Days 90-4 5,129 2.99 15,314 5-14 476 4.73 2,252 115-24 2,564 2.65 6,787 2 25-34 3,248 2.42 7,857 35-44 1,819 3.13 5,696 45-54 1,314 4.10 5,393 5 55-64 1,253 4.48 5,610 5 65-74 1,867 5.07 9,471 75+ 2,303 5.49 12,642 Total 19,973 3.56 71,022 2 Age Cohort Discharges 0-4 2,631 5-14 243 15-24 405 25-34 325 35-44 434 45-54 505 55-64 625 65-74 1,008 75+ 932 Total 7,108 Males ALOS 2.99 4.65 4.48 4.79 4.15 4.25 4.40 5.30 5.41 4.14 Patient Days 7,867 1,129 1,816 1,556 1,799 2,146 2,749 5,345 5,042 29,449 Females Age Cohort Discharges ALOS Patient Days 0-4 2,498 2.98 7,447 5-14 233 4.82 1,123 15-24 2,159 2.30 4,971 25-34 2,923 2.16 6,301 35-44 1,385 2.81 3,897 45-54 809 4.01 3,247 55-64 628 4.56 2,861 65-74 859 4.80 4,126 75+ 1,371 5.54 7,600 Total 12,865 3.23 41,573 Source: Utah Office of Health Data Analysis QUESTION 10 Given a Davis County elderly population increase of 6.3% (based on 2016), and an elderly discharge rate increase of 2.1% (2016), how many elderly discharges would you project. For the toolbar, press ALT+F10 (PC) or ALT+FN+F10 (Mac). B I U Paragraph Arial 10pt A 4o T. V 1a Population Data by Age and Sex, 2016 Age Cohort Males Females Totals 0-4 10,371 9,693 20,064 5-14 22,100 20,969 43,069 15-24 20,345 19,708 40,053 25-34 17,512 16,016 33,528 35-44 16,671 16,927 33,598 45-54 11,326 11,597 22,923 155-64 6,930 7,345 14,275 265-74 4,823 5,018 9,841 75+ 2,464 3,504 5,968 Total 112,542 110,777 223,319 5 3 1b Selected Hospital Utilization Data by Age and Sex, 2016 Age Cohort Discharges ALOS Patient Days 90-4 5,129 2.99 15,314 5-14 476 4.73 2,252 115-24 2,564 2.65 6,787 2 25-34 3,248 2.42 7,857 35-44 1,819 3.13 5,696 45-54 1,314 4.10 5,393 5 55-64 1,253 4.48 5,610 5 65-74 1,867 5.07 9,471 75+ 2,303 5.49 12,642 Total 19,973 3.56 71,022 2 Age Cohort Discharges 0-4 2,631 5-14 243 15-24 405 25-34 325 35-44 434 45-54 505 55-64 625 65-74 1,008 75+ 932 Total 7,108 Males ALOS 2.99 4.65 4.48 4.79 4.15 4.25 4.40 5.30 5.41 4.14 Patient Days 7,867 1,129 1,816 1,556 1,799 2,146 2,749 5,345 5,042 29,449 Females Age Cohort Discharges ALOS Patient Days 0-4 2,498 2.98 7,447 5-14 233 4.82 1,123 15-24 2,159 2.30 4,971 25-34 2,923 2.16 6,301 35-44 1,385 2.81 3,897 45-54 809 4.01 3,247 55-64 628 4.56 2,861 65-74 859 4.80 4,126 75+ 1,371 5.54 7,600 Total 12,865 3.23 41,573 Source: Utah Office of Health Data Analysis


