

Question: Question 11 1 pts A retrospective study looking at the association between cannbis use and psychosis reports OR = 1.67, 95% CI (1.09, 2.54). Which
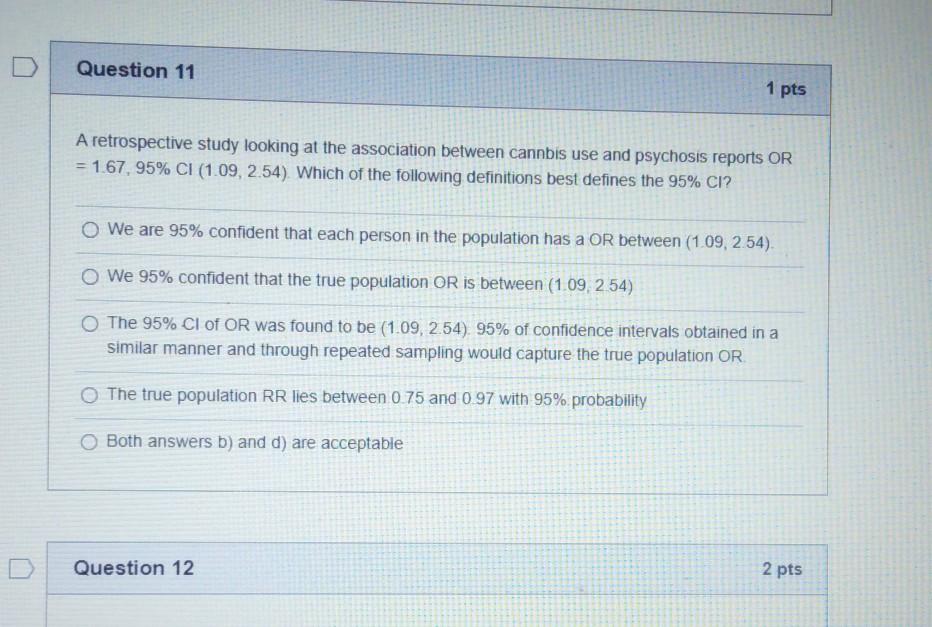
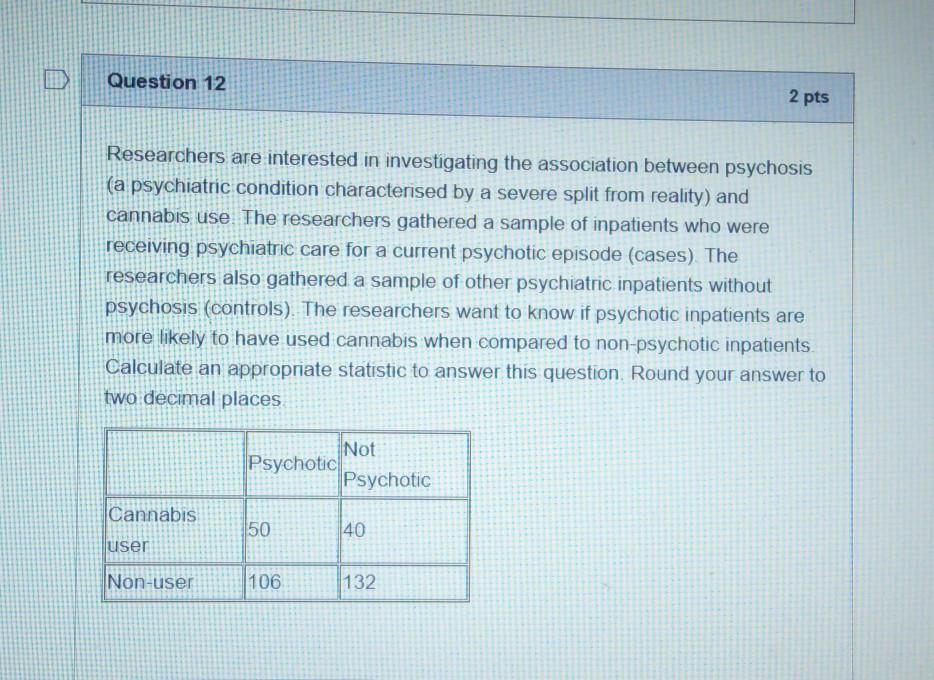
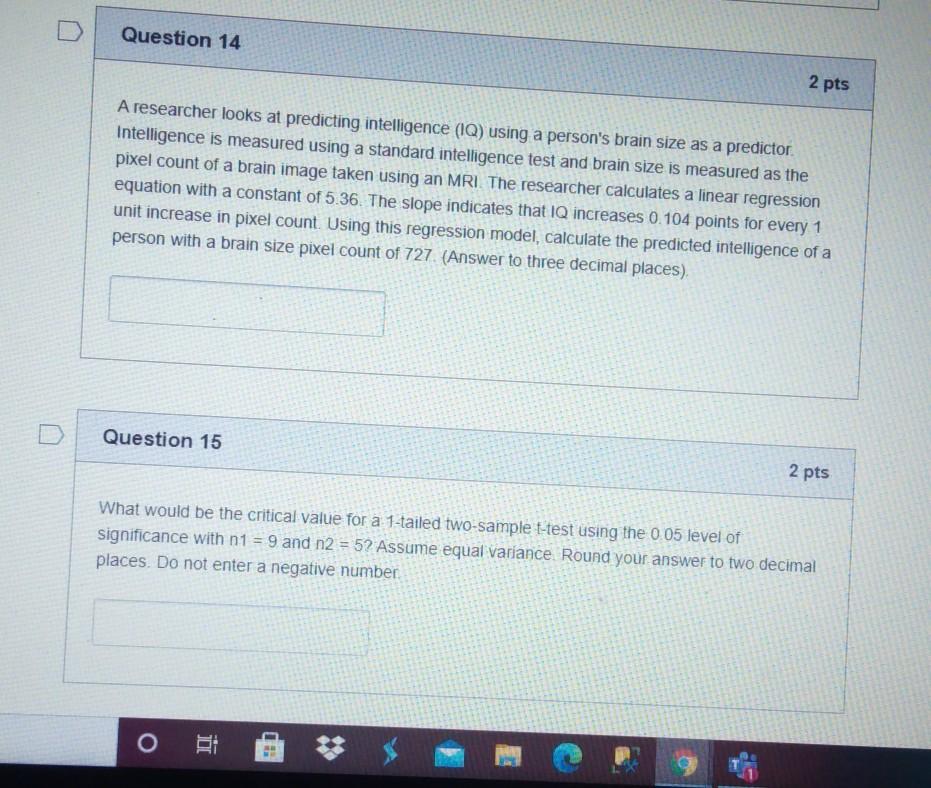
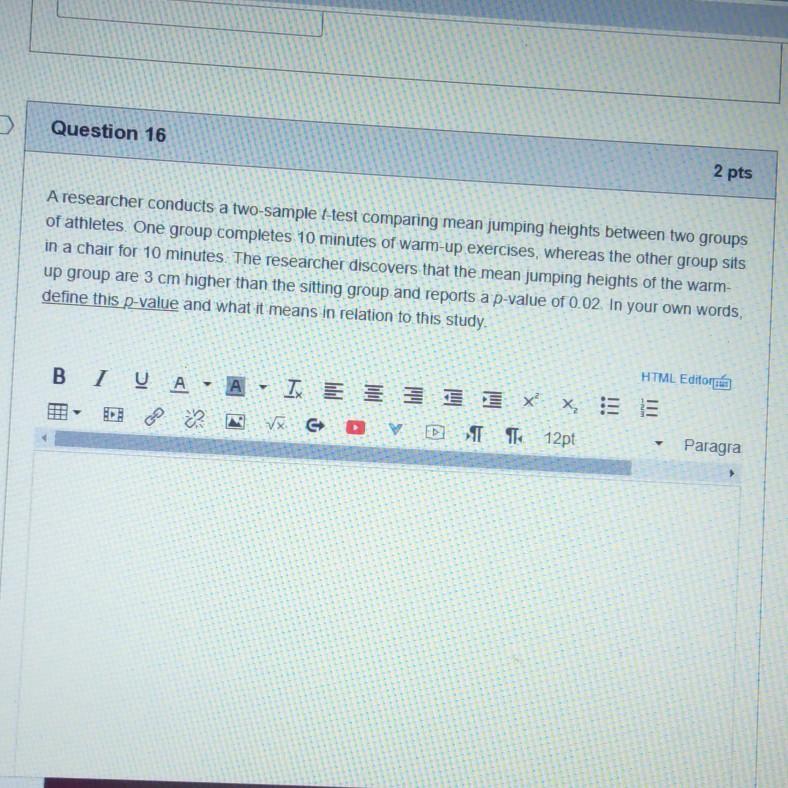
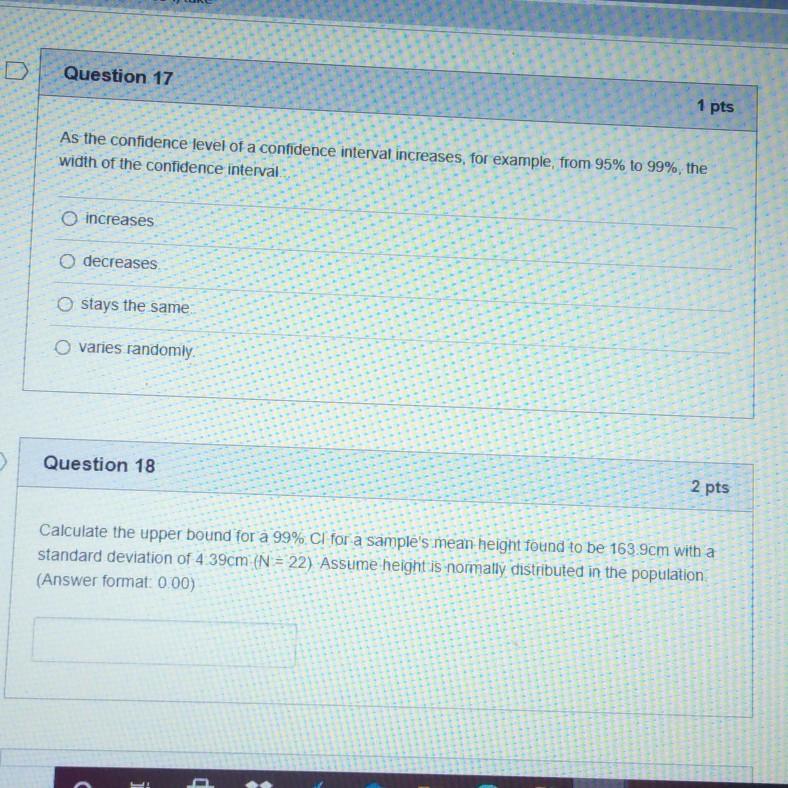
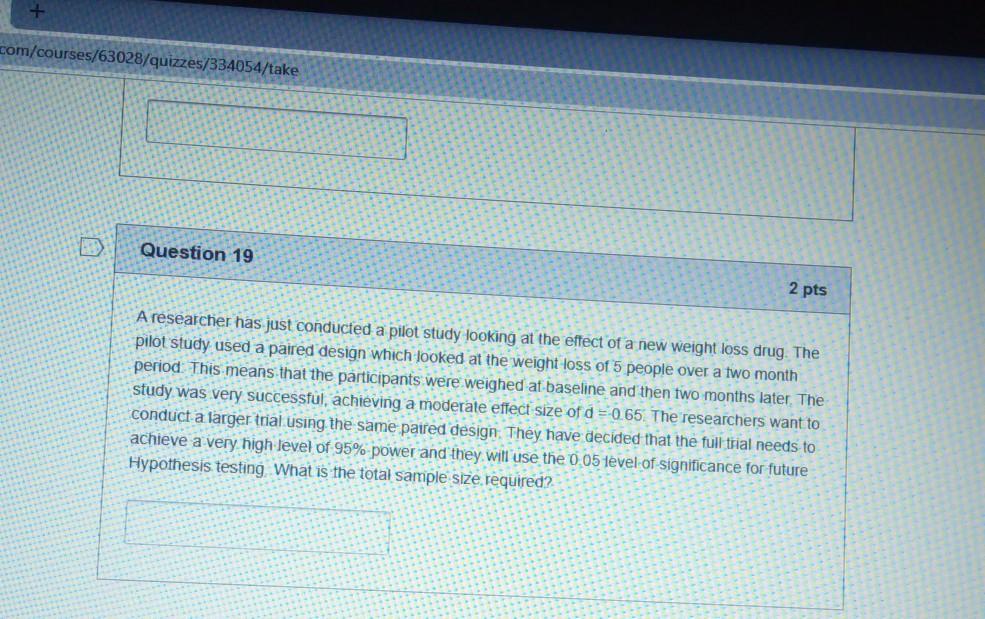
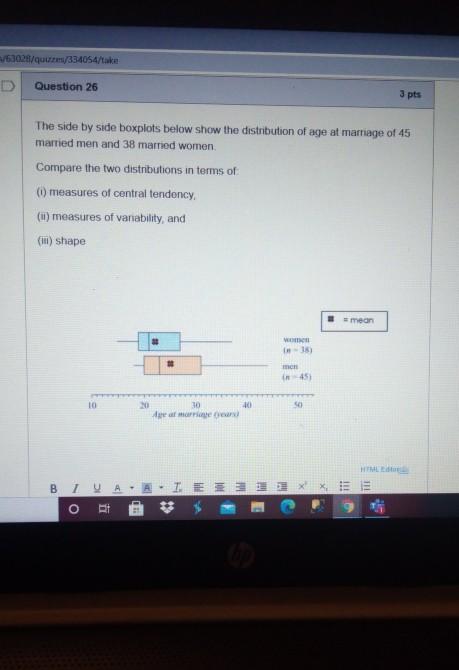
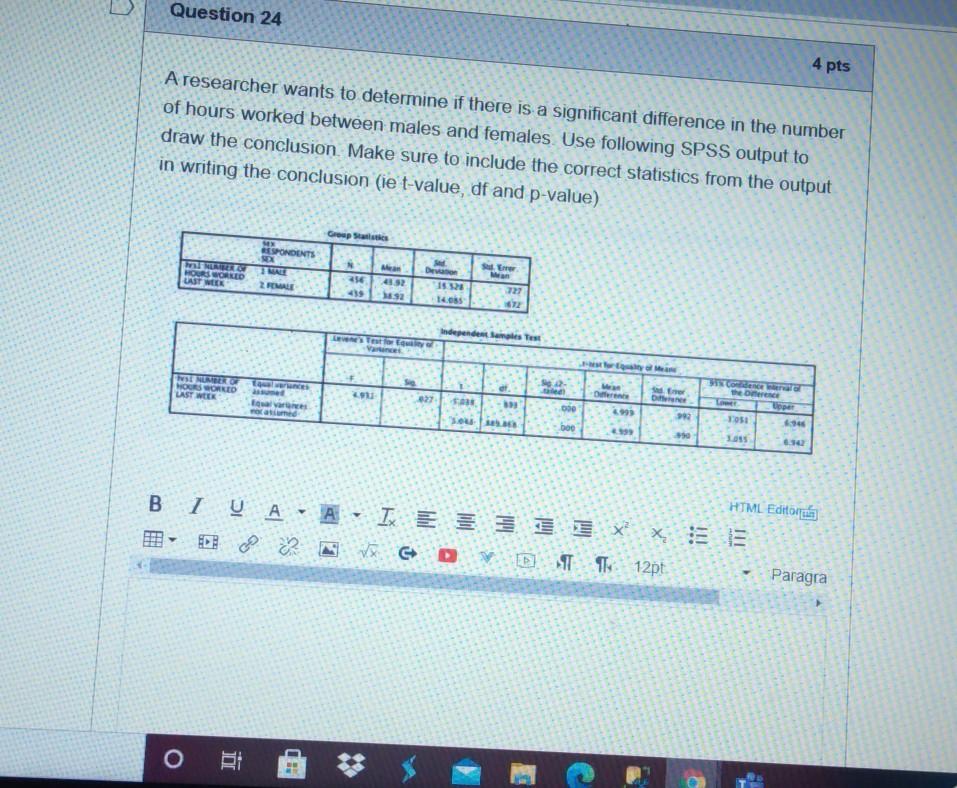
Question 11 1 pts A retrospective study looking at the association between cannbis use and psychosis reports OR = 1.67, 95% CI (1.09, 2.54). Which of the following definitions best defines the 95% CI? We are 95% confident that each person in the population has a OR between (1.09, 2.54) We 95% confident that the true population OR is between (1.09 2 54) The 95% CI of OR was found to be (1.09, 2.54) 95% of confidence intervals obtained in a similar manner and through repeated sampling would capture the true population OR The true population RR lies between 0 75 and 0.97 with 95% probability Both answers b) and d) are acceptable Question 12 2 pts Question 12 2 pts Researchers are interested in investigating the association between psychosis (a psychiatric condition characterised by a severe split from reality) and cannabis use. The researchers gathered a sample of inpatients who were receiving psychiatric care for a current psychotic episode (cases) The researchers also gathered a sample of other psychiatric inpatients without psychosis (controls). The researchers want to know if psychotic inpatients are more likely to have used cannabis when compared to non-psychotic inpatients Calculate an appropriate statistic to answer this question. Round your answer to two decimal places Not Psychotic Psychotic Cannabis 50 40 user Non-user 106 132 Question 14 2 pts A researcher looks at predicting intelligence (IQ) using a person's brain size as a predictor Intelligence is measured using a standard intelligence test and brain size is measured as the pixel count of a brain image taken using an MRI. The researcher calculates a linear regression equation with a constant of 5.36. The slope indicates that IQ increases 0.104 points for every 1 unit increase in pixel count. Using this regression model, calculate the predicted intelligence of a person with a brain size pixel count of 727 (Answer to three decimal places). Question 15 2 pts What would be the critical value for a 1-tailed two-sample t-test using the 0.05 level of significance with n1 = 9 and n2 = 52 Assume equal variance Round your answer to two decimal places. Do not enter a negative number I DI Question 16 2 pts A researcher conducts a two-sample t-test comparing mean jumping heights between two groups of athletes. One group completes 10 minutes of warm-up exercises, whereas the other group sits in a chair for 10 minutes. The researcher discovers that the mean jumping heights of the warm- up group are 3 cm higher than the sitting group and reports a p-value of 0.02 In your own words, define this p-value and what it means in relation to this study HTML Editora BIU A - A - I E II 1 x VC DV TE 12pt x : Paragra Question 17 1 pts As the confidence level of a confidence interval increases, for example, from 95% to 99%, the width of the confidence interval o increases decreases Ostays the same varies randomly. Question 18 2 pts Calculate the upper bound for a 99% Cl for a sample's mean height found to be 163.9cm with a standard deviation of 4.39cm (N = 22) Assume height is normally distributed in the population (Answer format: 0.00) com/courses/63028/quizzes/334054/take Question 19 2 pts A researcher has just conducted a pilot study looking at the effect of a new weight loss drug. The pilot study used a paired design which looked at the weight loss of 5 people over a two month period. This means that the participants were weighed af baseline and then two months later. The study was very successful, achieving a moderate effect size of d = 0.65. The researchers want to conduct a larger trial using the same paired design. They have decided that the full trial needs to achieve a very high level of 95% power and they will use the 0.05 level of significance for future Hypothesis testing What is the total sample size required? 1/63028/quum/334054/take Question 26 3 pts The side by side boxplots below show the distribution of age at marriage of 45 married men and 38 married women Compare the two distributions in terms of measures of central tendency (ii) measures of vanability, and (i) shape meon MAIN In - 151 45 10 10 so Age of HTML IN A . IEEE il X X o et C --- O Question 25 4 pts The weights of an important subcomponent are normally distributed with mean of 63.7g and variation of 99, (a) Find the probability that if 50 units are randomly selected, their mean weight is less than 65g. Show all working (b) Close examination showed that the weights are not normally distributed. Is the answer in part (a) would be changed? And why? B HTML Editor I A. AIXXE DEN VDVDT 12pt Paragra Question 23 6 pts A researcher wants to estimate the proportion of residents who tested positive to COVID19 in a metropolitan suburb. The researcher examined the records for a random sample of 150 residents, from the suburb population of 5000 residents. The researcher determined that 40 residents have tested positive from the random sample 1. Construct 99% confidence interval for the population proportion of residents that will test positive. Make sure to show all your working 2. If the suburb population is 10000 residents will the width of the 99% confidence interval change? Explain your reasoning HTML Editora B IV AA- IX E53 XX, DSV GODT 12pt Paragra Question 24 4 pts A researcher wants to determine if there is a significant difference in the number of hours worked between males and females Use following SPSS output to draw the conclusion Make sure to include the correct statistics from the output in writing the conclusion (ie t-value, df and p-value) RESPONDENTS HOURS WORLD LAST WEEK Z MALE 4352 14.08 Independentem Test Trio NOSSORED LAST MEER Corner there 29 Der Sur 000 Sou 992 FOS bo 550 HTML Editoru BIU A - A - I E IIX xes 2 X & DVD 1 12pt. Paragra OR
Step by Step Solution
There are 3 Steps involved in it
1 Expert Approved Answer
Step: 1 Unlock

Question Has Been Solved by an Expert!
Get step-by-step solutions from verified subject matter experts
Step: 2 Unlock
Step: 3 Unlock