

Question: Question 11 (4 points) You need to visualize a dataset by analyzing only one data variable for the purpose of understanding how frequent that data
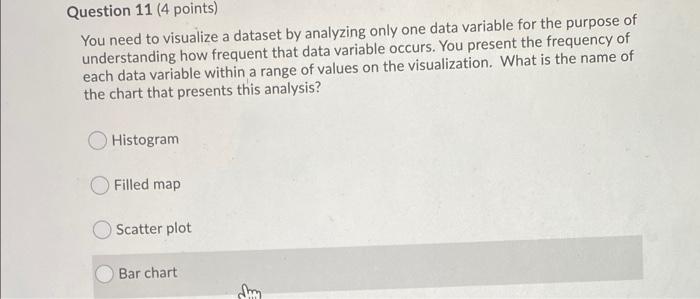
Question 11 (4 points) You need to visualize a dataset by analyzing only one data variable for the purpose of understanding how frequent that data variable occurs. You present the frequency of each data variable within a range of values on the visualization. What is the name of the chart that presents this analysis? Histogram Filled map Scatter plot Bar chart Com
Step by Step Solution
There are 3 Steps involved in it
1 Expert Approved Answer
Step: 1 Unlock

Question Has Been Solved by an Expert!
Get step-by-step solutions from verified subject matter experts
Step: 2 Unlock
Step: 3 Unlock