

Question: Question 11: Answer the following question using the brewing production size dataset. Which production size (by barrel) saw the biggest increase in the number of
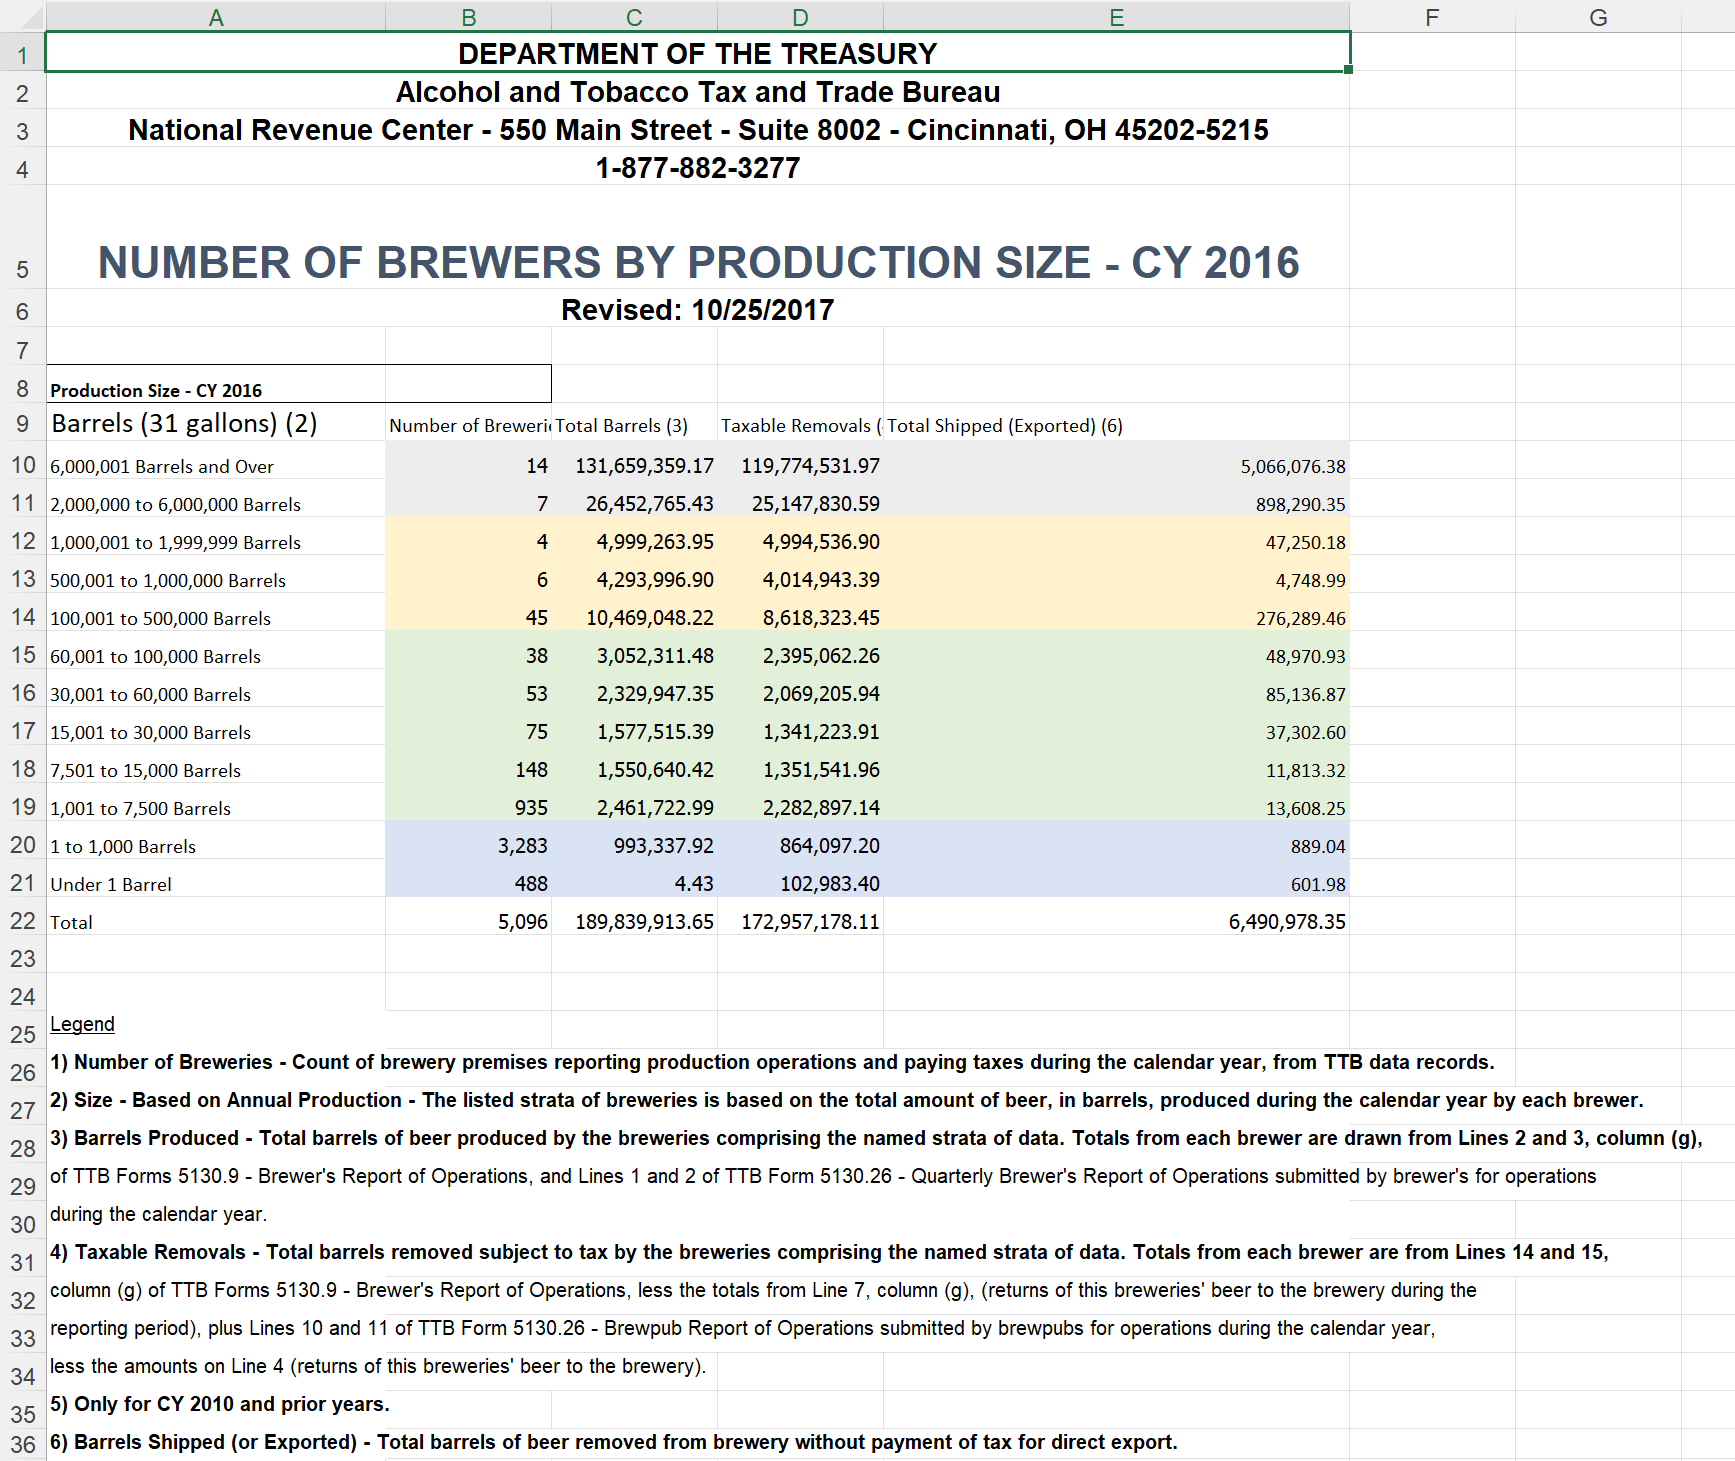
Question 11: Answer the following question using the brewing production size dataset. Which production size (by barrel) saw the biggest increase in the number of breweries in 2018? 1. Under 1 barrel 2. 1 to 1k barrels 3. 1k to 7,5k barrels 4. 7,5k to 15k barrels
Question 9: Using the Apples dataset, answer the following question: What is the average price per cup equivalent for fresh and ready to drink apples?
1. 0.4353
2. 0.3754
3. 0.3156
4. 0.2973
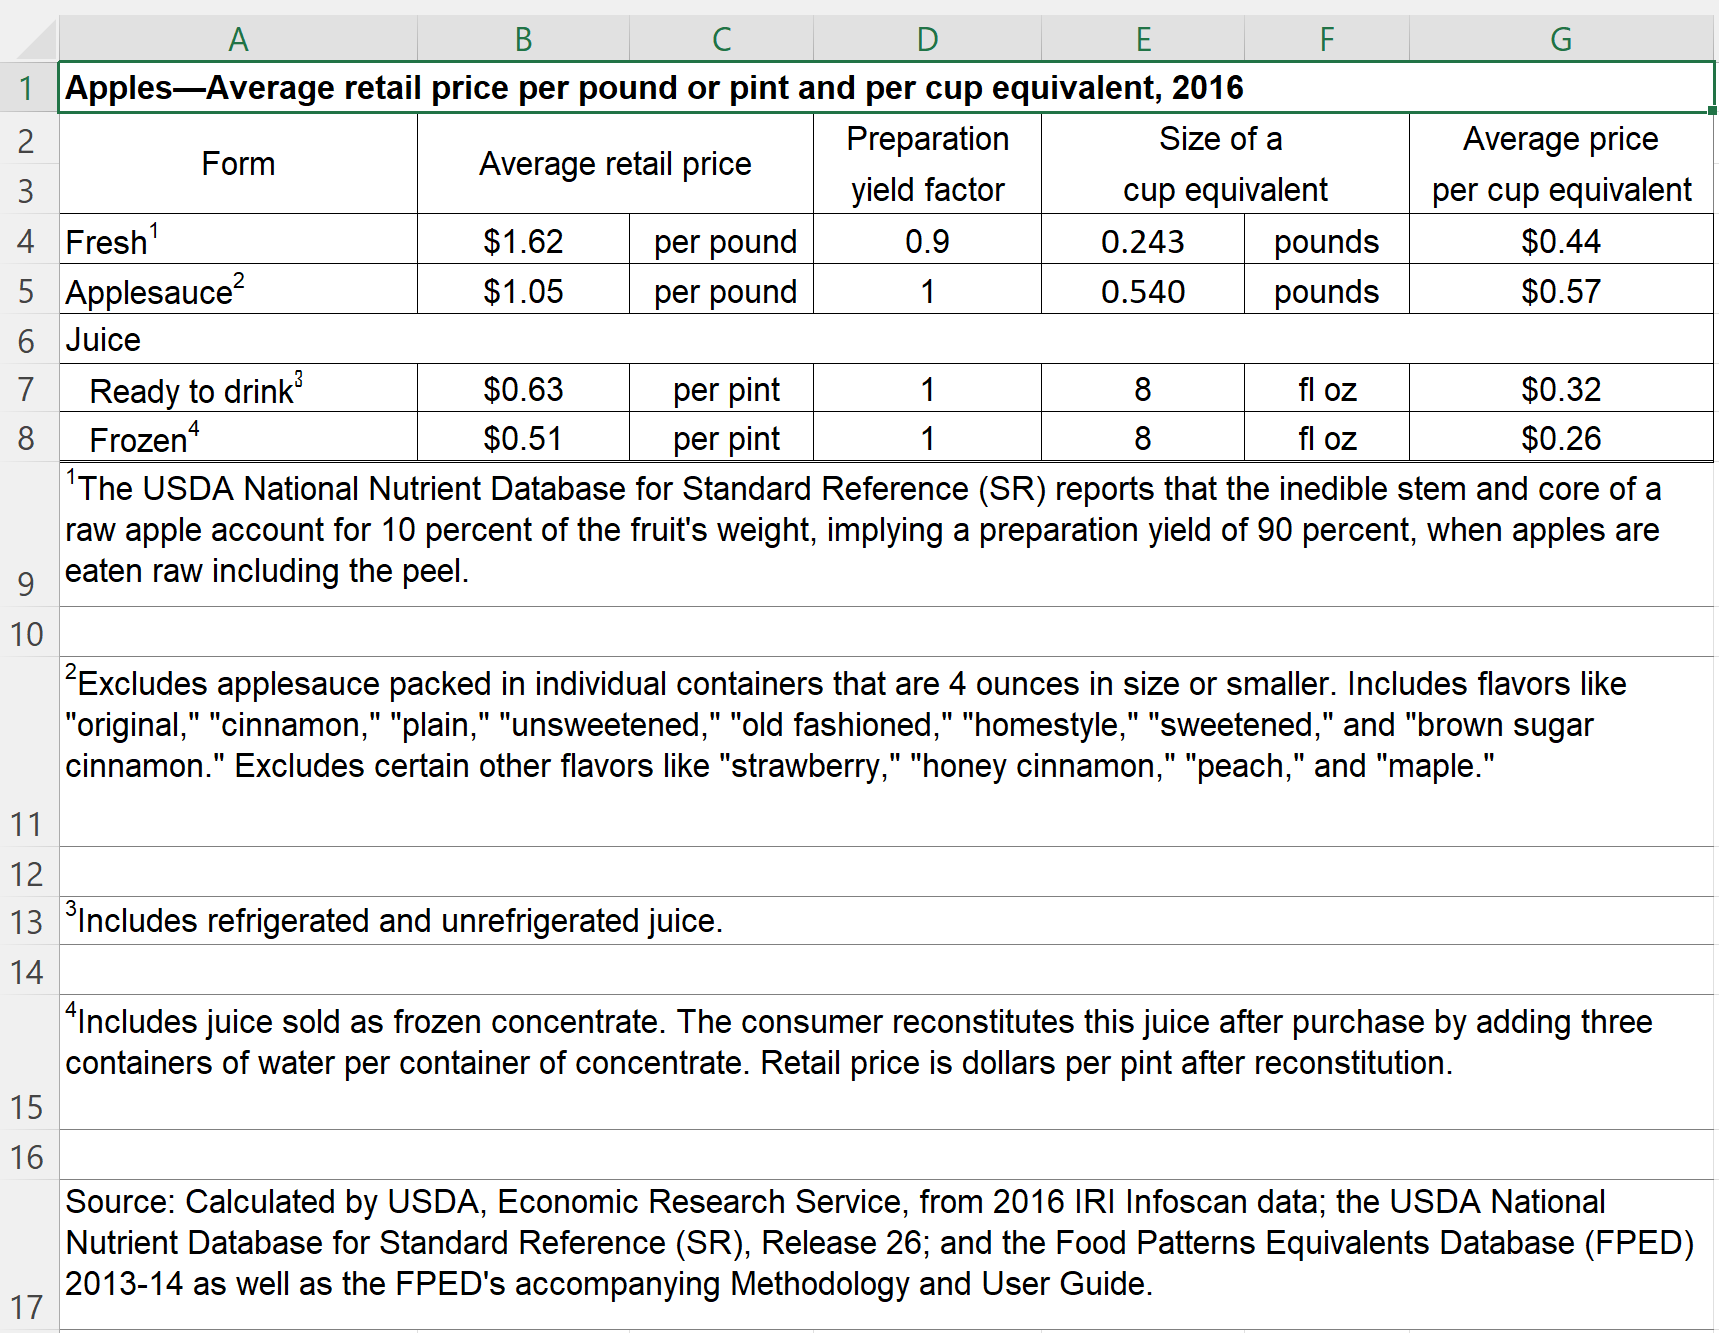
1) Number of Breweries - Count of brewery premises reporting production operations and paying taxes during the calendar year, from TTB data records. 2) Size - Based on Annual Production - The listed strata of breweries is based on the total amount of beer, in barrels, produced during the calendar year by each brewer. 3) Barrels Produced - Total barrels of beer produced by the breweries comprising the named strata of data. Totals from each brewer are drawn from Lines 2 and 3 , column (g), of TTB Forms 5130.9 - Brewer's Report of Operations, and Lines 1 and 2 of TTB Form 5130.26 - Quarterly Brewer's Report of Operations submitted by brewer's for operations during the calendar year. 4) Taxable Removals - Total barrels removed subject to tax by the breweries comprising the named strata of data. Totals from each brewer are from Lines 14 and 15 , column (g) of TTB Forms 5130.9 - Brewer's Report of Operations, less the totals from Line 7 , column (g), (returns of this breweries' beer to the brewery during the reporting period), plus Lines 10 and 11 of TTB Form 5130.26 - Brewpub Report of Operations submitted by brewpubs for operations during the calendar year, less the amounts on Line 4 (returns of this breweries' beer to the brewery). 5) Only for CY2010 and prior years. 6) Barrels Shipped (or Exported) - Total barrels of beer removed from brewery without payment of tax for direct export. raw apple account for 10 percent of the fruit's weight, implying a preparation yield of 90 percent, when apples are eaten raw including the peel. 2 Excludes applesauce packed in individual containers that are 4 ounces in size or smaller. Includes flavors like "original," "cinnamon," "plain," "unsweetened," "old fashioned," "homestyle," "sweetened," and "brown sugar cinnamon." Excludes certain other flavors like "strawberry," "honey cinnamon," "peach," and "maple." 3 Includes refrigerated and unrefrigerated juice. 4 Includes juice sold as frozen concentrate. The consumer reconstitutes this juice after purchase by adding three containers of water per container of concentrate. Retail price is dollars per pint after reconstitution. Source: Calculated by USDA, Economic Research Service, from 2016 IRI Infoscan data; the USDA National Nutrient Database for Standard Reference (SR), Release 26; and the Food Patterns Equivalents Database (FPED) 2013-14 as well as the FPED's accompanying Methodology and User Guide. 1) Number of Breweries - Count of brewery premises reporting production operations and paying taxes during the calendar year, from TTB data records. 2) Size - Based on Annual Production - The listed strata of breweries is based on the total amount of beer, in barrels, produced during the calendar year by each brewer. 3) Barrels Produced - Total barrels of beer produced by the breweries comprising the named strata of data. Totals from each brewer are drawn from Lines 2 and 3 , column (g), of TTB Forms 5130.9 - Brewer's Report of Operations, and Lines 1 and 2 of TTB Form 5130.26 - Quarterly Brewer's Report of Operations submitted by brewer's for operations during the calendar year. 4) Taxable Removals - Total barrels removed subject to tax by the breweries comprising the named strata of data. Totals from each brewer are from Lines 14 and 15 , column (g) of TTB Forms 5130.9 - Brewer's Report of Operations, less the totals from Line 7 , column (g), (returns of this breweries' beer to the brewery during the reporting period), plus Lines 10 and 11 of TTB Form 5130.26 - Brewpub Report of Operations submitted by brewpubs for operations during the calendar year, less the amounts on Line 4 (returns of this breweries' beer to the brewery). 5) Only for CY2010 and prior years. 6) Barrels Shipped (or Exported) - Total barrels of beer removed from brewery without payment of tax for direct export. raw apple account for 10 percent of the fruit's weight, implying a preparation yield of 90 percent, when apples are eaten raw including the peel. 2 Excludes applesauce packed in individual containers that are 4 ounces in size or smaller. Includes flavors like "original," "cinnamon," "plain," "unsweetened," "old fashioned," "homestyle," "sweetened," and "brown sugar cinnamon." Excludes certain other flavors like "strawberry," "honey cinnamon," "peach," and "maple." 3 Includes refrigerated and unrefrigerated juice. 4 Includes juice sold as frozen concentrate. The consumer reconstitutes this juice after purchase by adding three containers of water per container of concentrate. Retail price is dollars per pint after reconstitution. Source: Calculated by USDA, Economic Research Service, from 2016 IRI Infoscan data; the USDA National Nutrient Database for Standard Reference (SR), Release 26; and the Food Patterns Equivalents Database (FPED) 2013-14 as well as the FPED's accompanying Methodology and User Guide
Step by Step Solution
There are 3 Steps involved in it

Get step-by-step solutions from verified subject matter experts