

Question: Question 12 2 pts Examine the below regression table (note that any significance stars have been removed): feolsCY ~ X + A. . Dependent Var.
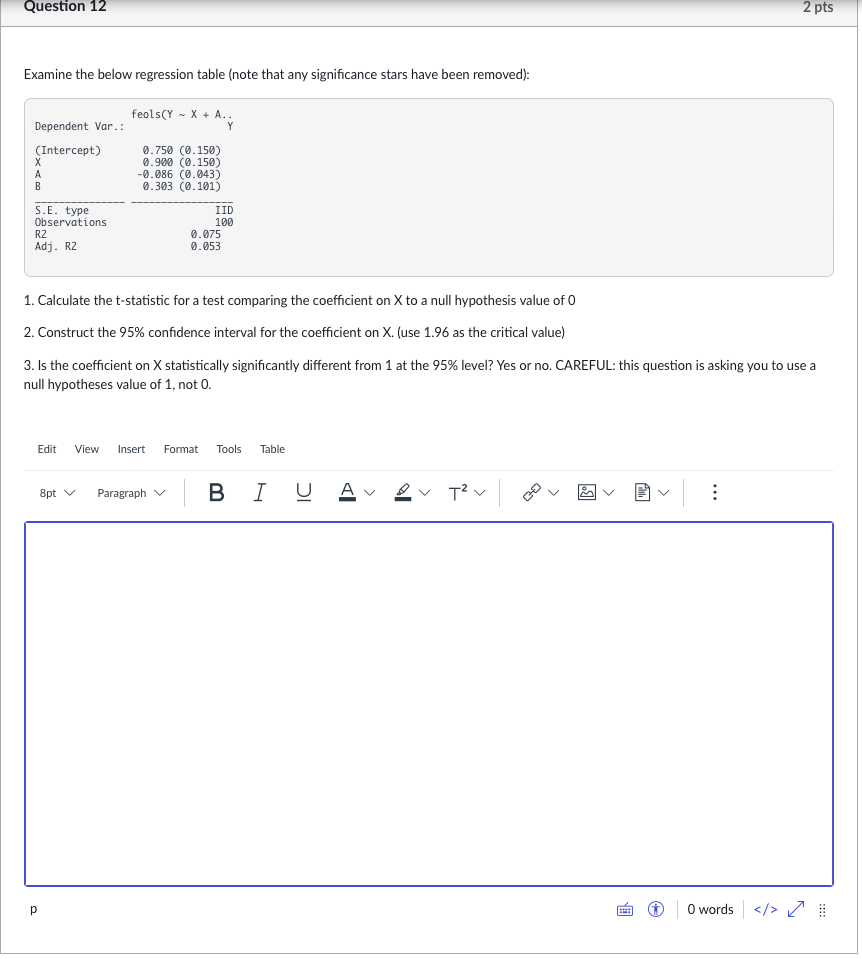

Question 12 2 pts Examine the below regression table (note that any significance stars have been removed): feolsCY ~ X + A. . Dependent Var. : (Intercept) 0. 750 (0.150) 0.900 (0.150) -0.086 (0.043) 0.303 (0.101) S. E. type IID Observations 100 RZ 0.075 Adj. RZ 0.053 1. Calculate the t-statistic for a test comparing the coefficient on X to a null hypothesis value of 0 2. Construct the 95% confidence interval for the coefficient on X. (use 1.96 as the critical value) 3. Is the coefficient on X statistically significantly different from 1 at the 95% level? Yes or no. CAREFUL: this question is asking you to use a null hypotheses value of 1, not 0. Edit View Insert Format Tools Table 8pt Paragraph BI U A &V T V . . . :83 1 0 words >
Step by Step Solution
There are 3 Steps involved in it

Get step-by-step solutions from verified subject matter experts