

Question: Question 12 Question 13 Question 14 Question 15 The recruiting process for a full-time master's program in data science consists of the following steps. The
Question 12
Question 13
Question 14
Question 15
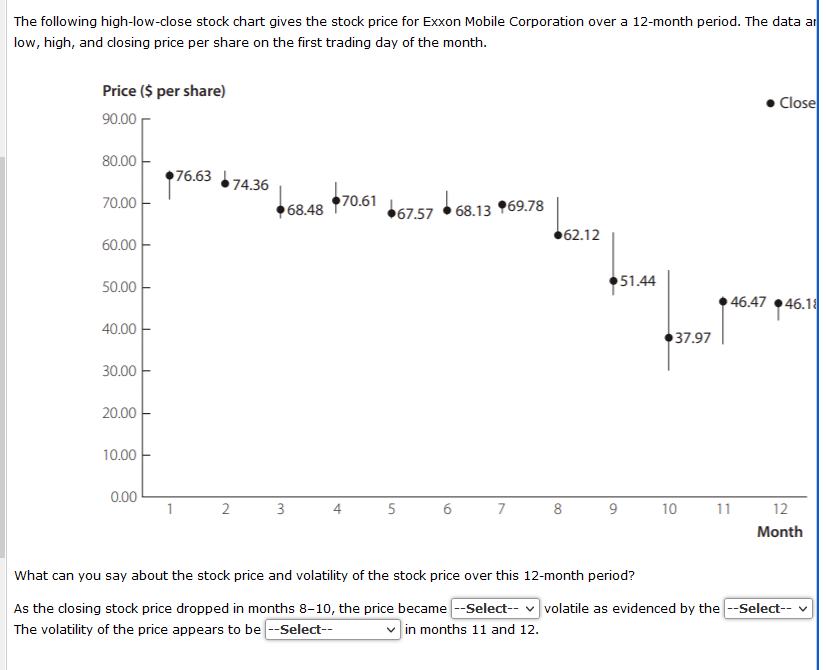
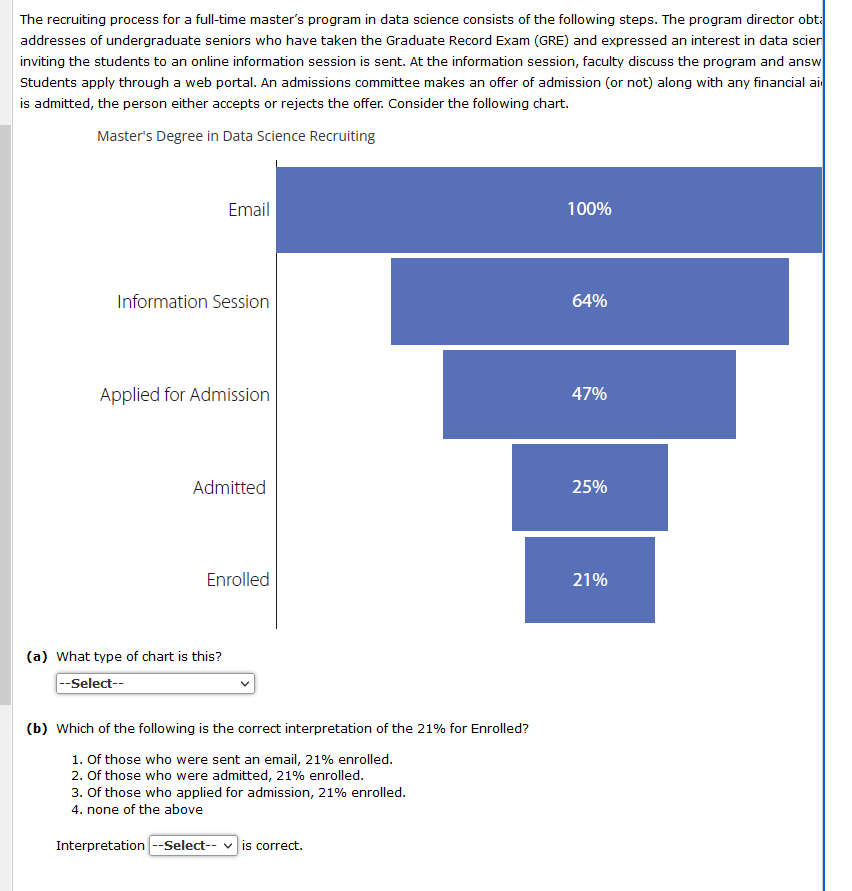
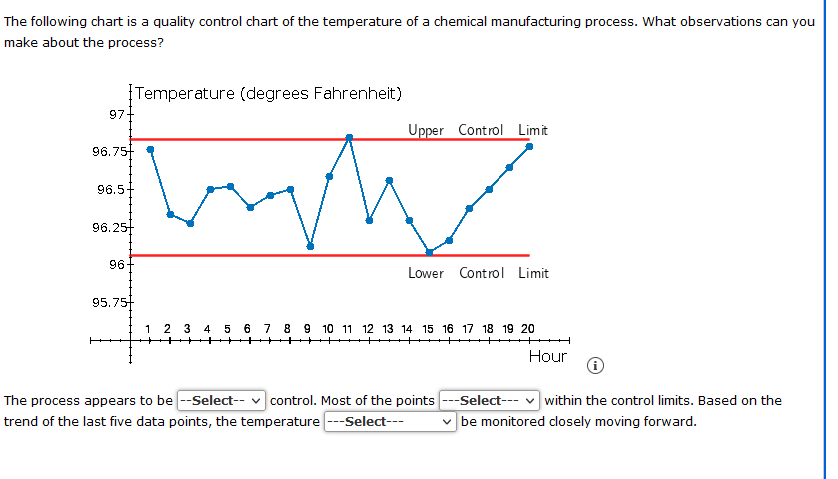
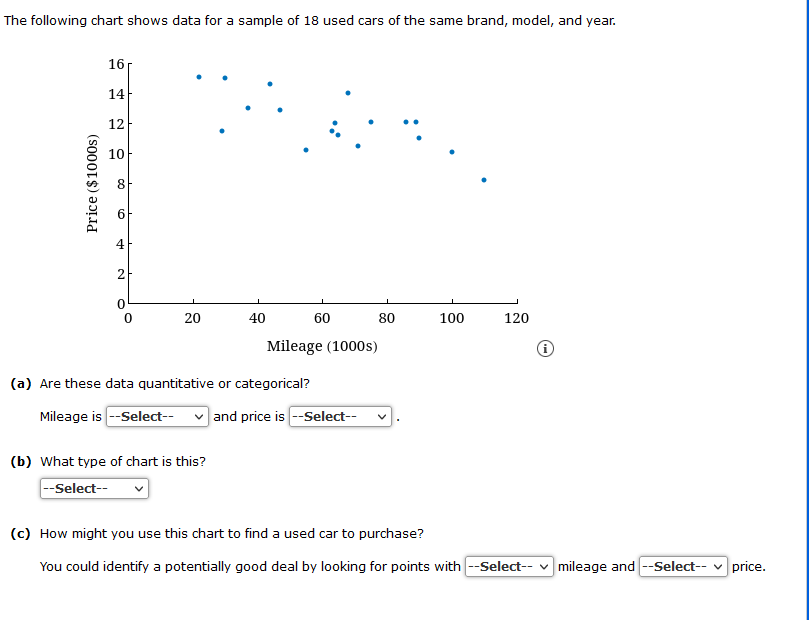
The recruiting process for a full-time master's program in data science consists of the following steps. The program director obt: addresses of undergraduate seniors who have taken the Graduate Record Exam (GRE) and expressed an interest in data scier inviting the students to an online information session is sent. At the information session, faculty discuss the program and answ Students apply through a web portal. An admissions committee makes an offer of admission (or not) along with any financial ai, is admitted, the person either accepts or rejects the offer. Consider the following chart. Master's Degree in Data Science Recruiting Email Information Session Applied for Admission Admitted 100% 64% Enrolled 21% (a) What type of chart is this? (b) Which of the following is the correct interpretation of the 21% for Enrolled? 1. Of those who were sent an email, 21% enrolled. 2. Of those who were admitted, 21% enrolled. 3. Of those who applied for admission, 21% enrolled. 4. none of the above Interpretation is correct. The following chart is a quality control chart of the temperature of a chemical manufacturing process. What observations can you make about the process? (i) The process appears to be control. Most of the points within the control limits. Based on the trend of the last five data points, the temperature be monitored closely moving forward. The following chart shows data for a sample of 18 used cars of the same brand, model, and year. (a) Are these data quantitative or categorical? Mileage is and price is (b) What type of chart is this? (c) How might you use this chart to find a used car to purchase? You could identify a potentially good deal by looking for points with mileage and price. The following high-low-close stock chart gives the stock price for Exxon Mobile Corporation over a 12-month period. The data ar low, high, and closing price per share on the first trading day of the month. What can you say about the stock price and volatility of the stock price over this 12-month period? As the closing stock price dropped in months 8-10, the price became volatile as evidenced by the The volatility of the price appears to be in months 11 and 12. The recruiting process for a full-time master's program in data science consists of the following steps. The program director obt: addresses of undergraduate seniors who have taken the Graduate Record Exam (GRE) and expressed an interest in data scier inviting the students to an online information session is sent. At the information session, faculty discuss the program and answ Students apply through a web portal. An admissions committee makes an offer of admission (or not) along with any financial ai, is admitted, the person either accepts or rejects the offer. Consider the following chart. Master's Degree in Data Science Recruiting Email Information Session Applied for Admission Admitted 100% 64% Enrolled 21% (a) What type of chart is this? (b) Which of the following is the correct interpretation of the 21% for Enrolled? 1. Of those who were sent an email, 21% enrolled. 2. Of those who were admitted, 21% enrolled. 3. Of those who applied for admission, 21% enrolled. 4. none of the above Interpretation is correct. The following chart is a quality control chart of the temperature of a chemical manufacturing process. What observations can you make about the process? (i) The process appears to be control. Most of the points within the control limits. Based on the trend of the last five data points, the temperature be monitored closely moving forward. The following chart shows data for a sample of 18 used cars of the same brand, model, and year. (a) Are these data quantitative or categorical? Mileage is and price is (b) What type of chart is this? (c) How might you use this chart to find a used car to purchase? You could identify a potentially good deal by looking for points with mileage and price. The following high-low-close stock chart gives the stock price for Exxon Mobile Corporation over a 12-month period. The data ar low, high, and closing price per share on the first trading day of the month. What can you say about the stock price and volatility of the stock price over this 12-month period? As the closing stock price dropped in months 8-10, the price became volatile as evidenced by the The volatility of the price appears to be in months 11 and 12
Step by Step Solution
There are 3 Steps involved in it

Get step-by-step solutions from verified subject matter experts