

Question: Question 12 This question refers to the graph shown below. Number of Knee and Hip Replacement Procedures (1996 to 2006) 40000 35000 30000 25000 Number
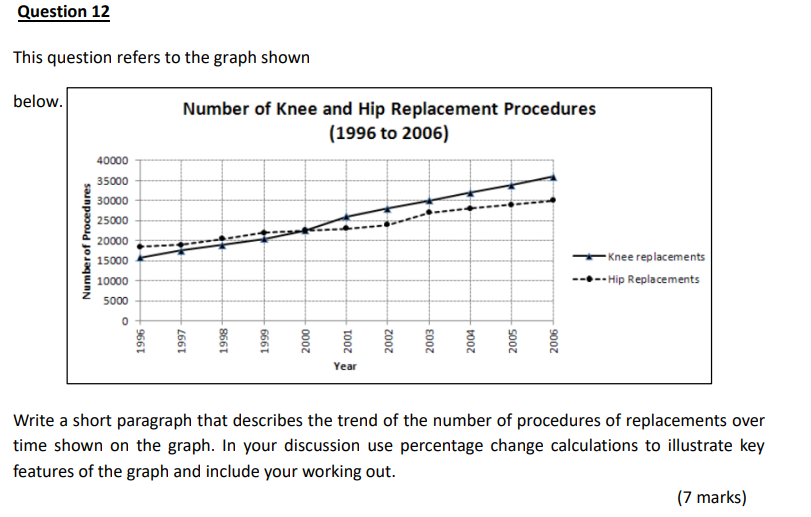

Question 12 This question refers to the graph shown below. Number of Knee and Hip Replacement Procedures (1996 to 2006) 40000 35000 30000 25000 Number of Procedures 20000 15000 Knee replacements 10000 --0 -- Hip Replacements 5000 1996 - 2006 2005 2004 2002 1998 2000 2003 2001 1999 1997 Year Write a short paragraph that describes the trend of the number of procedures of replacements over time shown on the graph. In your discussion use percentage change calculations to illustrate key features of the graph and include your working out. (7 marks)
Step by Step Solution
There are 3 Steps involved in it
1 Expert Approved Answer
Step: 1 Unlock

Question Has Been Solved by an Expert!
Get step-by-step solutions from verified subject matter experts
Step: 2 Unlock
Step: 3 Unlock