

Question: Question 12 Using the given information about forecasts for an aggregate planning spanning through September 2019 February 2020 (production in hours) with 60 production hour
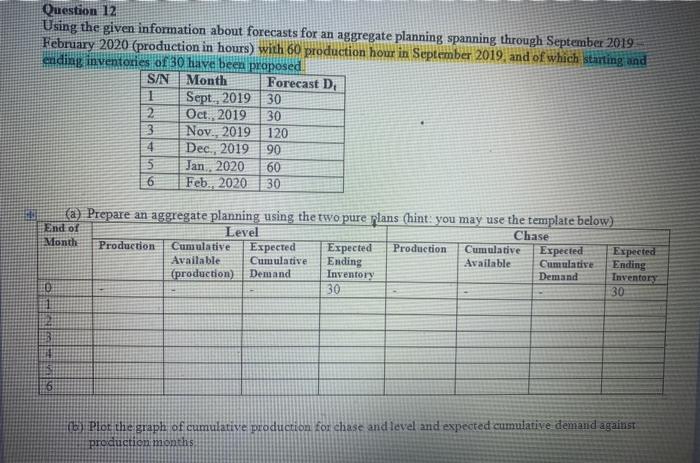
Question 12 Using the given information about forecasts for an aggregate planning spanning through September 2019 February 2020 (production in hours) with 60 production hour in September 2019, and of which starting and ending inventories of 30 have been proposed. S/N Month Forecast D 1 Sept. 2019 30 2 Oct. 2019 30 3 Nov. 2019 120 Dec., 2019 .90 5 Jan, 2020 60 6 Feb., 2020 30 4 (a) Prepare an aggregate planning using the two pure plans (hint: you may use the template below) End of Level Chase Month Production Cumulative Expected Expected Production Cumulative Expected Expected Available Cumulative Ending Available Cumulative Ending {production) Demand Inventory Demand Inventory 30 30 en ba Plot the graph of cumulative production for chase and level and expected cumulative demand against production months Question 12 Using the given information about forecasts for an aggregate planning spanning through September 2019 February 2020 (production in hours) with 60 production hour in September 2019, and of which starting and ending inventories of 30 have been proposed. S/N Month Forecast D 1 Sept. 2019 30 2 Oct. 2019 30 3 Nov. 2019 120 Dec., 2019 .90 5 Jan, 2020 60 6 Feb., 2020 30 4 (a) Prepare an aggregate planning using the two pure plans (hint: you may use the template below) End of Level Chase Month Production Cumulative Expected Expected Production Cumulative Expected Expected Available Cumulative Ending Available Cumulative Ending {production) Demand Inventory Demand Inventory 30 30 en ba Plot the graph of cumulative production for chase and level and expected cumulative demand against production months
Step by Step Solution
There are 3 Steps involved in it

Get step-by-step solutions from verified subject matter experts