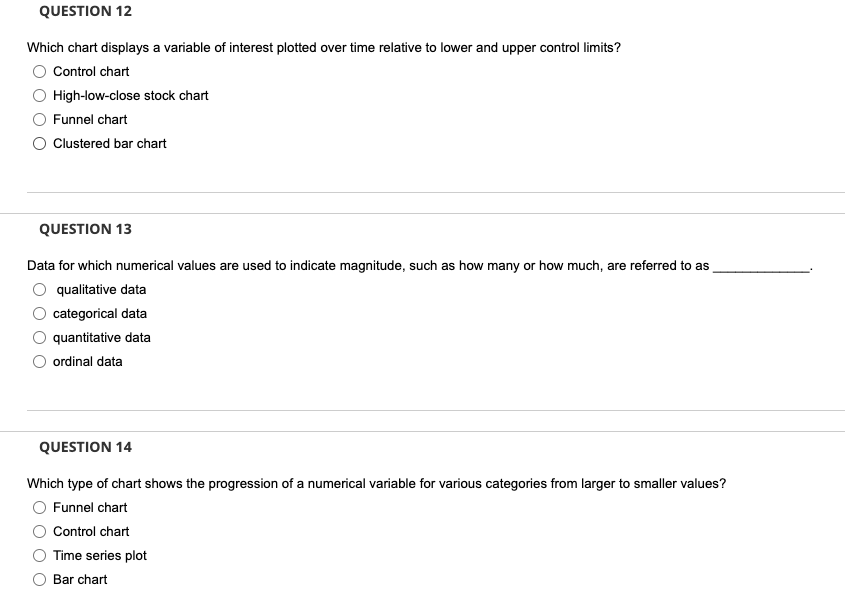
Question: QUESTION 12 Which chart displays a variable of interest plotted over time relative to lower and upper control limits? Control chart High-low-close stock chart Funnel

QUESTION 12 Which chart displays a variable of

QUESTION 12 Which chart displays a variable of interest plotted over time relative to lower and upper control limits? Control chart High-low-close stock chart Funnel chart O Clustered bar chart QUESTION 13 Data for which numerical values are used to indicate magnitude, such as how many or how much, are referred to as qualitative data categorical data O quantitative data O ordinal data QUESTION 14 Which type of chart shows the progression of a numerical variable for various categories from larger to smaller values ? Funnel chart Control chart Time series plot Bar chart

Step by Step Solution

There are 3 Steps involved in it

1 Expert Approved Answer
Step: 1 Unlock blur-text-image
Question Has Been Solved by an Expert!

Get step-by-step solutions from verified subject matter experts

Step: 2 Unlock
Step: 3 Unlock

Students Have Also Explored These Related General Management Questions!