

Question: Question 13 (20 points) - To be handwritten and submitted via email A car wash process for generic cars has three stations and information as
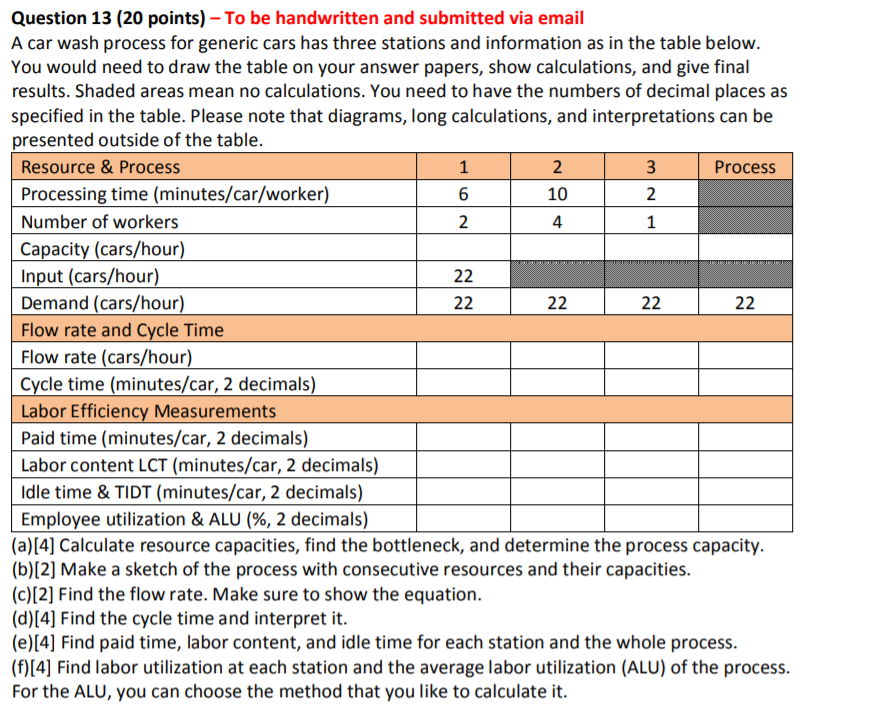
Question 13 (20 points) - To be handwritten and submitted via email A car wash process for generic cars has three stations and information as in the table below. You would need to draw the table on your answer papers, show calculations, and give final results. Shaded areas mean no calculations. You need to have the numbers of decimal places as specified in the table. Please note that diagrams, long calculations, and interpretations can be presented outside of the table. Resource & Process 1 | 2 | 3 Process | Processing time (minutes/car/worker) 6 10 2 Number of workers 2 4 1 Capacity (cars/hour) Input (cars/hour) Demand (cars/hour) 22 22 22 Flow rate and Cycle Time Flow rate (cars/hour) Cycle time (minutes/car, 2 decimals) Labor Efficiency Measurements Paid time (minutes/car, 2 decimals) Labor content LCT (minutes/car, 2 decimals) i Idle time & TIDT (minutes/car, 2 decimals) Employee utilization & ALU (%, 2 decimals) (a)[4] Calculate resource capacities, find the bottleneck, and determine the process capacity. (b)[2] Make a sketch of the process with consecutive resources and their capacities. (c)[2] Find the flow rate. Make sure to show the equation. (d)[4] Find the cycle time and interpret it. (e)[4] Find paid time, labor content, and idle time for each station and the whole process. (f)[4] Find labor utilization at each station and the average labor utilization (ALU) of the process. For the ALU, you can choose the method that you like to calculate it. Question 13 (20 points) - To be handwritten and submitted via email A car wash process for generic cars has three stations and information as in the table below. You would need to draw the table on your answer papers, show calculations, and give final results. Shaded areas mean no calculations. You need to have the numbers of decimal places as specified in the table. Please note that diagrams, long calculations, and interpretations can be presented outside of the table. Resource & Process 1 | 2 | 3 Process | Processing time (minutes/car/worker) 6 10 2 Number of workers 2 4 1 Capacity (cars/hour) Input (cars/hour) Demand (cars/hour) 22 22 22 Flow rate and Cycle Time Flow rate (cars/hour) Cycle time (minutes/car, 2 decimals) Labor Efficiency Measurements Paid time (minutes/car, 2 decimals) Labor content LCT (minutes/car, 2 decimals) i Idle time & TIDT (minutes/car, 2 decimals) Employee utilization & ALU (%, 2 decimals) (a)[4] Calculate resource capacities, find the bottleneck, and determine the process capacity. (b)[2] Make a sketch of the process with consecutive resources and their capacities. (c)[2] Find the flow rate. Make sure to show the equation. (d)[4] Find the cycle time and interpret it. (e)[4] Find paid time, labor content, and idle time for each station and the whole process. (f)[4] Find labor utilization at each station and the average labor utilization (ALU) of the process. For the ALU, you can choose the method that you like to calculate it
Step by Step Solution
There are 3 Steps involved in it

Get step-by-step solutions from verified subject matter experts