

Question: Question 13 Add the predictor variable Hypertension to the linear probability model and compute the confusion matrix, accuracy, true positive rate, and false positive rate
Question 13
Add the predictor variable Hypertension to the linear probability model and compute the confusion matrix, accuracy, true positive rate, and false positive rate for a probability threshold of 0.5.
| Min. | 1st Qu. | Median | Mean | 3rd Qu. | Max. | |
|---|---|---|---|---|---|---|
| probability | 0 | 0.11 | 0.17 | 0.18 | 0.23 | 0.48 |
| prediction | 0 | 0.00 | 0.00 | 0.00 | 0.00 | 0.00 |
## Predicted ## Actual 0 Total ## 0 395 395 ## 1 105 105 ## Total 500 500
## [1] 0.79
## [1] 0
## [1] 0
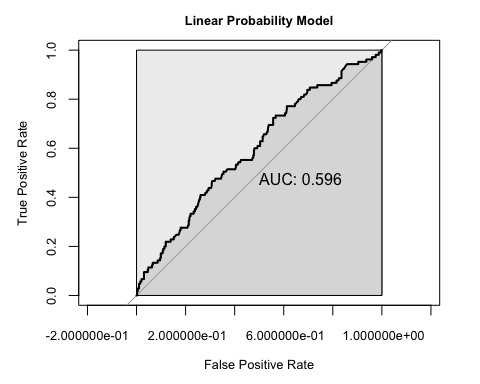
True Positive Rate 0.0 0.2 0.4 0.6 0.8 1.0 -2.000000e-01 2.000000e-01 6.000000e-01 1.000000e+00 False Positive Rate Linear Probability Model AUC: 0.596\f
Step by Step Solution
There are 3 Steps involved in it
1 Expert Approved Answer
Step: 1 Unlock

Question Has Been Solved by an Expert!
Get step-by-step solutions from verified subject matter experts
Step: 2 Unlock
Step: 3 Unlock