

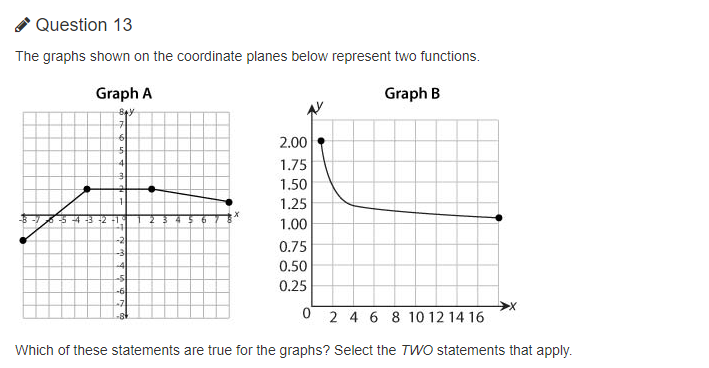
Question: Question 13 The graphs shown on the coordinate planes below represent two functions. Graph A Graph B 2.00 1.75 1.50 1.25 X 23456 1.00 0.75


Step by Step Solution
There are 3 Steps involved in it
1 Expert Approved Answer
Step: 1 Unlock

Question Has Been Solved by an Expert!
Get step-by-step solutions from verified subject matter experts
Step: 2 Unlock
Step: 3 Unlock