

Question: Question 14 (2 marks) Take a look at the table below: Regression mode] of grades as a function of hours of studying and years in
![Regression mode] of grades as a function of hours of studying and](https://s3.amazonaws.com/si.experts.images/answers/2024/06/667aee0a38b69_362667aee0a069b5.jpg)
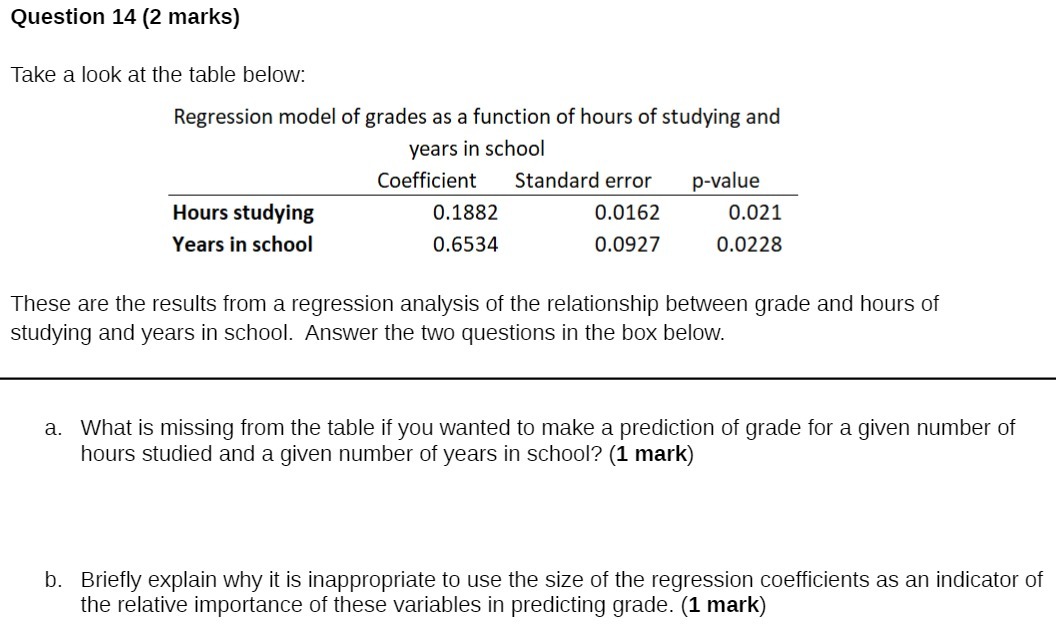
Question 14 (2 marks) Take a look at the table below: Regression mode] of grades as a function of hours of studying and years in school Coefcient Standard error p-value Hours studying 0.1882 0.0162 0.021 Years in school 0.6534 0.0927 0.0228 These are the results from a regression analysis of the relationship between grade and hours of studying and years in school. Answer the two questions in the box below. a. What is missing from the table if you wanted to make a prediction of grade for a given number of hours studied and a given number of years in school? (1 mark) b. Briefly explain why it is inappropriate to use the size of the regression coefficients as an indicator of the relative importance of these variables in predicting grade. (1 mark)
Step by Step Solution
There are 3 Steps involved in it

Get step-by-step solutions from verified subject matter experts