

Question: Question 14 Chapter 6. DO 1-5 QUESTIONS. a) Establish a control chart for monitoring the average weights of the bowling balls in which the upper
Question 14 Chapter 6. DO 1-5 QUESTIONS. 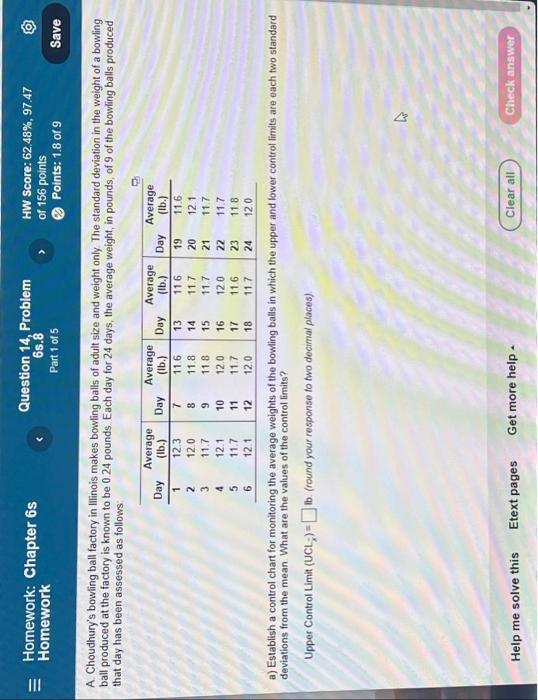
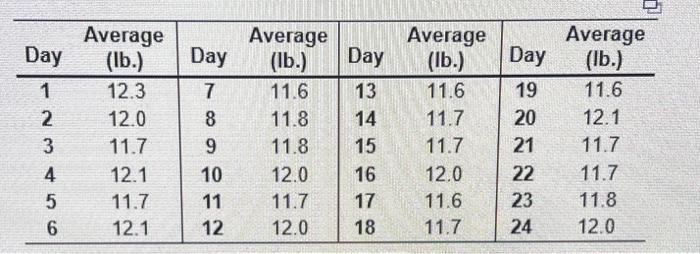
||| Homework: Chapter 6s Homework Day 1 2 3 4 5 6 Help me solve this A Choudhury's bowling ball factory in Illinois makes bowling balls of adult size and weight only The standard deviation in the weight of a bowling ball produced at the factory is known to be 0 24 pounds. Each day for 24 days, the average weight, in pounds, of 9 of the bowling balls produced that day has been assessed as follows Average (lb.) 12.3 Question 14, Problem 6s.8 Part 1 of 5 12.0 11.7 12.1 11.7 12.1 Etext pages Day 7 8 9 10 11 12 Average (lb.) 11.6 11.8 11.8 12.0 11.7 12.0 Day 13 14 Get more help 15 16 17 18 Average (lb.) 11.6 HW Score: 62.48%, 97.47 of 156 points Points: 1.8 of 9 Day 19 11.7 20 11.7 21 12.0 11.6 11.7 Average (lb.) 11.6 12.1 11.7 22 11.7 23 11.8 24 12.0 a) Establish a control chart for monitoring the average weights of the bowling balls in which the upper and lower control limits are each two standard deviations from the mean. What are the values of the control limits? Upper Control Limit (UCL;)= b. (round your response to two decimal places) Save Clear all Check answer Day 1 2 3 4 56 Average (lb.) 12.3 12.0 11.7 12.1 11.7 12.1 Average Day (lb.) 7 11.6 8 9 10 11 12 Day 13 11.8 14 11.8 15 12.0 16 11.7 17 12.0 18 Average (lb.) 11.6 11.7 11.7 12.0 11.6 11.7 Day 19 20 21 22 23 24 Average (lb.) 11.6 12.1 11.7 11.7 11.8 12.0 a) Establish a control chart for monitoring the average weights of the bowling balls in which the upper and lower control limits are each two standard deviation from the mean. What are the values of the control limits?
1.) Upper Control Likit (UCL x) = ____ Ib. (round your response to two decimal places).
2.) Lower Control Limit (LCL x) = ____ Ib. (round your response to two decimal places).
b) If three standard deviations are used in the chart, what are the values of the control limits?
3.) Upper Control Limit (UCL x) = ___Ib. (round your response to two decimal places).
4.) Lower Control Limit (LCL x) = ___ Ib. (round your response to two decimal places).
5.) How do these values change?
a) The control limits for the 2-sigma x chart and for the 3-sigma x chart are the same
b) The control limits are tighter for the 3-sigma x chart than the 2-sigma x chart
c) The control limits are tighter for the 2-sigma x chart than for the 3-sigma x chart
Step by Step Solution
There are 3 Steps involved in it
1 Expert Approved Answer
Step: 1 Unlock

Question Has Been Solved by an Expert!
Get step-by-step solutions from verified subject matter experts
Step: 2 Unlock
Step: 3 Unlock