

Question: Question: 1.4) Prepare the monthly operating budget for 2018. Put yourself in the shoes of operations manager to discuss the budget challenges! A 1: Case
Question:
1.4) Prepare the monthly operating budget for 2018. Put yourself in the shoes of operations manager to discuss the budget challenges!
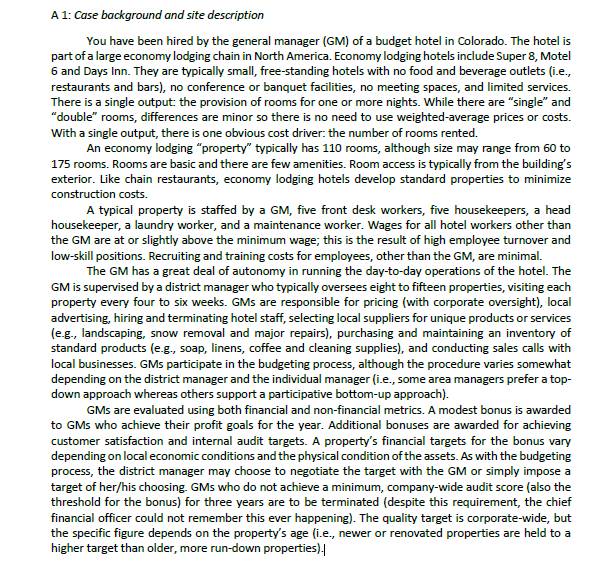
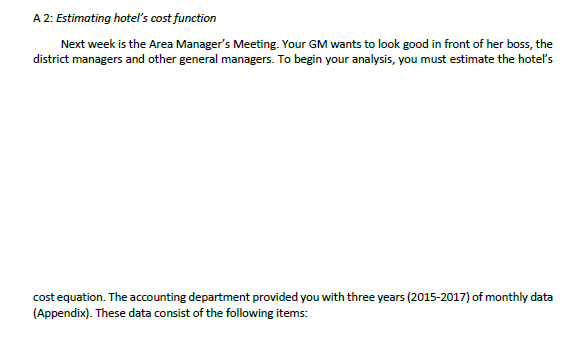
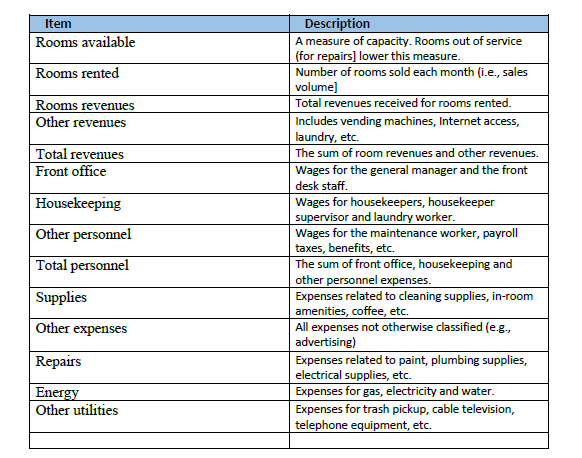
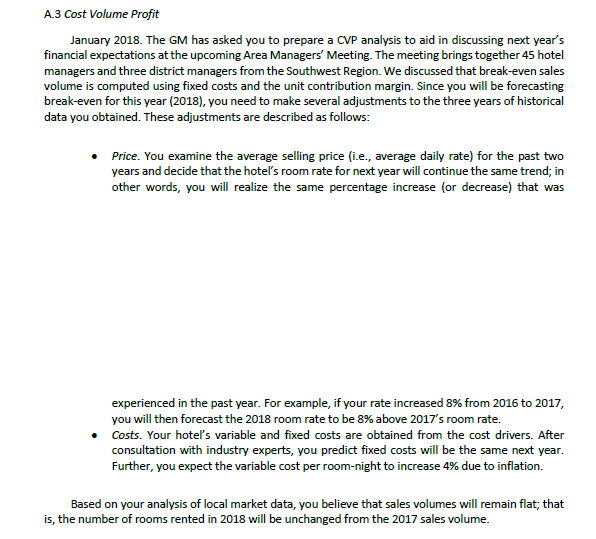
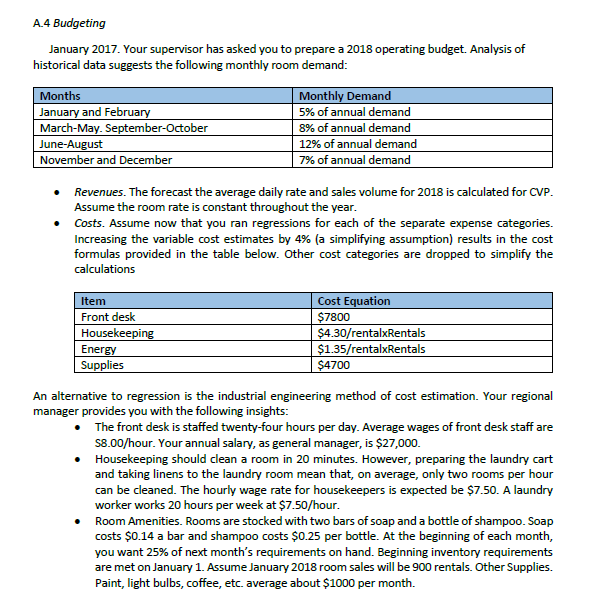
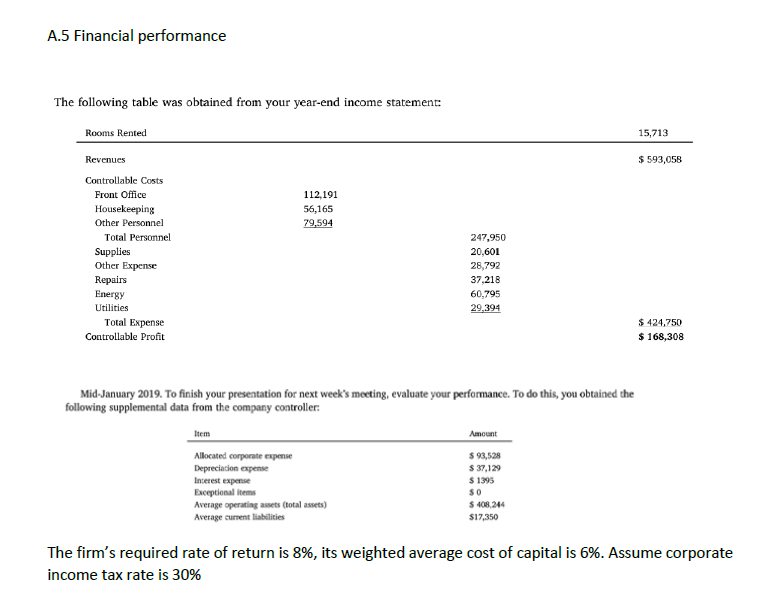
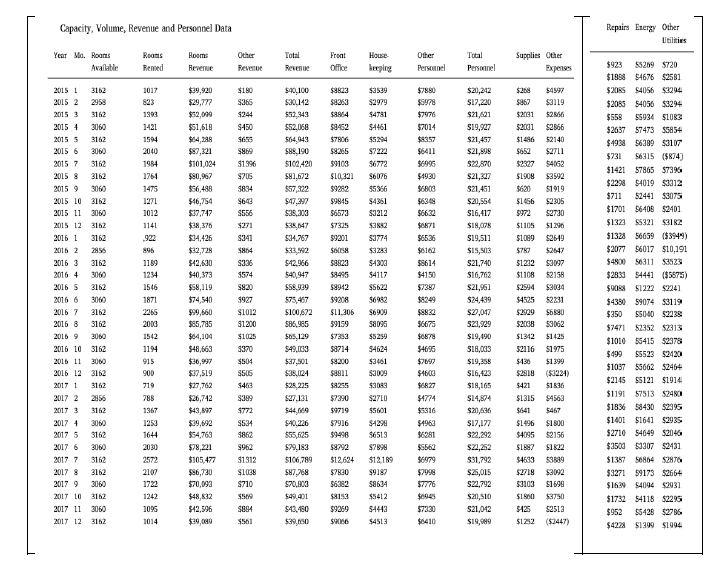
A 1: Case background and site description You have been hired by the general manager (GM) of a budget hotel in Colorado. The hotel is part of a large economy lodging chain in North America. Economy lodging hotels include Super 8, Motel 6 and Days Inn. They are typically small, free-standing hotels with no food and beverage outlets (i.e., restaurants and bars), no conference or banquet facilities, no meeting spaces, and limited services. There is a single output: the provision of rooms for one or more nights. While there are "single" and "double rooms, differences are minor so there is no need to use weighted average prices or costs. With a single output, there is one obvious cost driver: the number of rooms rented. An economy lodging "property" typically has 110 rooms, although size may range from 60 to 175 rooms. Rooms are basic and there are few amenities. Room access is typically from the building's exterior. Like chain restaurants, economy lodging hotels develop standard properties to minimize construction costs. A typical property is staffed by a GM, five front desk workers, five housekeepers, a head housekeeper, a laundry worker, and a maintenance worker. Wages for all hotel workers other than the GM are at or slightly above the minimum wage; this is the result of high employee turnover and low-skill positions. Recruiting and training costs for employees, other than the GM, are minimal. The GM has a great deal of autonomy in running the day-to-day operations of the hotel. The GM is supervised by a district manager who typically oversees eight to fifteen properties, visiting each property every four to six weeks. GMs are responsible for pricing (with corporate oversight), local advertising, hiring and terminating hotel staff, selecting local suppliers for unique products or services leg., landscaping, snow removal and major repairs), purchasing and maintaining an inventory of standard products (e.g., soap, linens, coffee and cleaning supplies), and conducting sales calls with local businesses. GMs participate in the budgeting process, although the procedure varies somewhat depending on the district manager and the individual manager (i.e., some area managers prefer a top- down approach whereas others support a participative bottom-up approach). GMs are evaluated using both financial and non-financial metrics. A modest bonus is awarded to GMs who achieve their profit goals for the year. Additional bonuses are awarded for achieving customer satisfaction and internal audit targets. A property's financial targets for the bonus vary depending on local economic conditions and the physical condition of the assets. As with the budgeting process, the district manager may choose to negotiate the target with the GM or simply impose a target of her/his choosing. GMs who do not achieve a minimum, company-wide audit score (also the threshold for the bonus) for three years are to be terminated (despite this requirement, the chief financial officer could not remember this ever happening). The quality target is corporate-wide, but the specific figure depends on the property's age (i.e., newer or renovated properties are held to a higher target than older, more run-down properties). A 2: Estimating hotel's cost function Next week is the Area Manager's Meeting. Your GM wants to look good in front of her boss, the district managers and other general managers. To begin your analysis, you must estimate the hotel's cost equation. The accounting department provided you with three years (2015-2017) of monthly data (Appendix). These data consist of the following items: Item Rooms available Rooms rented Rooms revenues Other revenues Total revenues Front office Housekeeping Other personnel Total personnel Description A measure of capacity. Rooms out of service (for repairs] lower this measure. Number of rooms sold each month (i.e., sales volume] Total revenues received for rooms rented. Includes vending machines, Internet access, laundry, etc. The sum of room revenues and other revenues. Wages for the general manager and the front desk staff. Wages for housekeepers, housekeeper supervisor and laundry worker. Wages for the maintenance worker, payroll taxes, benefits, etc. The sum of front office, housekeeping and other personnel expenses. Expenses related to cleaning supplies, in-room amenities, coffee, etc. All expenses not otherwise classified (e.g., advertising) Expenses related to paint, plumbing supplies, electrical supplies, etc. Expenses for gas, electricity and water. Expenses for trash pickup, cable television, telephone equipment, etc. Supplies Other expenses Repairs Energy Other utilities A. 3 Cost Volume Profit January 2018. The GM has asked you to prepare a CVP analysis to aid in discussing next year's financial expectations at the upcoming Area Managers' Meeting. The meeting brings together 45 hotel managers and three district managers from the Southwest Region. We discussed that break-even sales volume is computed using fixed costs and the unit contribution margin. Since you will be forecasting break-even for this year (2018), you need to make several adjustments to the three years of historical data you obtained. These adjustments are described as follows: Price. You examine the average selling price (i.e., average daily rate) for the past two years and decide that the hotel's room rate for next year will continue the same trend; in other words, you will realize the same percentage increase for decrease) that was experienced in the past year. For example, if your rate increased 8% from 2016 to 2017, you will then forecast the 2018 room rate to be 8% above 2017's room rate. Costs. Your hotel's variable and fixed costs are obtained from the cost drivers. After consultation with industry experts, you predict fixed costs will be the same next year. Further, you expect the variable cost per room-night to increase 4% due to inflation. Based on your analysis of local market data, you believe that sales volumes will remain flat, that is, the number of rooms rented in 2018 will be unchanged from the 2017 sales volume. A.4 Budgeting January 2017. Your supervisor has asked you to prepare a 2018 operating budget. Analysis of historical data suggests the following monthly room demand: Months January and February March-May. September October June-August November and December Monthly Demand 5% of annual demand 8% of annual demand 12% of annual demand 7% of annual demand Revenues. The forecast the average daily rate and sales volume for 2018 is calculated for CVP. Assume the room rate is constant throughout the year. Costs. Assume now that you ran regressions for each of the separate expense categories. Increasing the variable cost estimates by 4% (a simplifying assumption) results in the cost formulas provided in the table below. Other cost categories are dropped to simplify the calculations Item Front desk Housekeeping Energy Supplies Cost Equation $7800 $4.30/rentalxRentals $1.35/rentalxRentals $4700 An alternative to regression is the industrial engineering method of cost estimation. Your regional manager provides you with the following insights: The front desk is staffed twenty-four hours per day. Average wages of front desk staff are $8.00/hour. Your annual salary, as general manager, is $27,000. Housekeeping should clean a room in 20 minutes. However, preparing the laundry cart and taking linens to the laundry room mean that, on average, only two rooms per hour can be cleaned. The hourly wage rate for housekeepers is expected be $7.50. A laundry worker works 20 hours per week at $7.50/hour. Room Amenities. Rooms are stocked with two bars of soap and a bottle of shampoo. Soap costs $0.14 a bar and shampoo costs $0.25 per bottle. At the beginning of each month, you want 25% of next month's requirements on hand. Beginning inventory requirements are met on January 1. Assume January 2018 room sales will be 900 rentals. Other Supplies. Paint, light bulbs, coffee, etc. average about $1000 per month. A.5 Financial performance The following table was obtained from your year-end income statement: Rooms Rented 15,713 Revenues $ 593,058 112,191 56,165 79,594 Controllable Costs Front Office Housekeeping Other Personnel Total Personnel Supplies Other Expense Repairs Energy Utilities Total Expense Controllable Profit 247,950 20,601 28,792 37,218 60,795 29,394 $ 424,750 $ 168,308 Mid-January 2019. To finish your presentation for next week's meeting, evaluate your performance. To do this, you obtained the following supplemental data from the company controller: Amount Item Allocated corporate expense Depreciation expense Interest expense Exceptional Items Average operating assets (total assets) Average current liabilities $ 93,528 $ 37,129 $ 1395 SO $408.244 $17,350 The firm's required rate of return is 8%, its weighted average cost of capital is 6%. Assume corporate income tax rate is 30% Capacity, Volume, Revenue and Personnel Data Repairs Energy Other Utilities Rooms Year Ma. Roons Available Rooms Revenue Other Revenue Total Revende Front Office House keeping Other Personnel Total Persoanel Supplies Other Expenses Rented $29,920 $29,777 $52,090 $51,618 $3530 $2979 $4781 $4461 $5978 $7070 $7014 $867 $2001 $2001 $1496 $652 $6411 $87,321 $101,024 $190 $365 $244 $450 $65 $869 $1996 SZOS 5834 $643 S556 $231 8341 5854 $336 $3823 $8253 $984 $3462 $7806 $4265 $9103 $10,321 39242 $9845 $6573 $7325 59201 $ 58823 $4997 $3119 $256 $2866 52140 $2711 $4062 53592 $1919 $2305 52730 $1296 $4930 2015! 3162 2015 2 2958 2015 3 3162 2015 4 3060 2015 5 3162 2015 6 3080 2015 7 3162 2015 8 2015 3060 2015 20 3162 2015 11 3060 2015 12 3162 2016 1 3162 2016 2 2016 3 3162 2016 4 3060 2016 5 3162 2016 6 3060 2016 7 3162 2016 8 3162 2016 9 3000 2016 10 3162 2016 11 3000 2016 12 3162 2017 1 3162 2017 2 2856 2017 3 3162 2017 1 3000 2017 5 3162 2017 3060 2017 7 3162 2017 8 3162 2017 9 3060 201T 10 3162 2017 11 3060 2017 12 3152 $1908 $6.20 $1456 $972 $1105 $1089 1017 823 1393 1421 1504 2040 1984 1761 1475 1271 1012 1141 .922 896 1189 1234 1546 1871 2265 2000 1542 1194 915 900 719 785 1367 1253 1644 2030 2572 2107 1722 1242 1096 1014 $40,100 $30,142 $52,43 $52,068 $64,043 $88,190 $100420 $81,672 $57,322 $47,397 $38,303 $38,147 534.767 $33,2 542,966 540,947 $58,429 575,457 $100,672 586,985 $05,129 549,133 $37.501 $38.024 $28. 225 $27.131 $7222 56772 $6076 $5%66 $4361 $3212 $3642 $3774 $3253 $4320 $4117 $5622 56982 $6900 58096 $S250 54624 $3461 $2009 $56,488 $46,754 $37.747 $28,376 $34,426 $32,728 542,630 $40,373 $58,119 $74,540 $99,560 $55,795 $04,104 348,663 $36,97 $27,519 $27,762 $26,742 $43,897 $39,692 $54,763 $78,221 $105.477 $86,730 $70,098 $48,32 342,596 $39,040 $9942 $9308 $11.306 59159 $7353 58714 $6368 $6632 $1871 $6536 $6162 $8614 $4150 $7380 $8249 $8832 $6675 $0878 34696 $7097 $4600 $1212 $1108 $2594 54525 $29009 520038 $1342 52116 $20,242 $17,220 $21,621 $19,907 $21,457 $21,808 $22,870 $21,327 $21.451 $20,554 $16,417 $18,008 $19,511 $15,03 $21.740 $16,762 $21,961 $24.499 $2,047 $21.929 $19,490 $18,003 $19,356 $16,423 $18,165 $14,804 $21,636 $17,177 $22,292 $22,252 $31,792 $25,015 $22,792 $211,510 $21,042 $19,99 53097 52158 $3004 52231 $6890 53062 $1425 51975 $1399 $923 55209 5720 $1993 $4676 $2561 $2095 54056 $2294 $2055 $4056 $3294 $558 55934 $10R3 $2637 57473 $5854 $4933 56389 $3107 $731 $6315 $874) $1421 57865 $7396 $2298 $4019 $3312 $711 52441 $3075 $1701 56408 $2401 $1322 55321 32 $1328 56659 ($3949) $2077 56017 $10,191 $4800 56311 $3523 $2833 54441 ($5875) $9053 $1222 $7241 $4390 59074 $3119 $350 55040 $2238 $7471 52352 S2313 $1010 $5415 $2378 $499 55523 52420 $1037 55662 $2464 $2145 $5121 $1914. $1191 57513 524801 $1836 584302395 $1401 $1641 52935 $2710 54649 $2046 $3501 50307 $2431 $135756864 $2870 $3271 99173 $2664 $1639 54094 $2931 $1732 54118 $2295 $952 55428 $2786 $4228 $1399 $1994 $820 5927 S1012 $1200 $1025 3370 $504 SSOS $463 $389 9772 S534 5862 S962 $1312 $1038 5710 566 S884 $501 $2918 $4774 $40.226 $55.625 $79,183 $106,789 $87,768 570,803 $49,401 $43.450 530.000 $8811 $9255 $7290 $9719 $7916 $9498 $9792 $12,624 $7830 $6382 $8153 $9259 $2006 $2710 $5601 $4290 $6513 $7898 $12.189 9187 S8634 $5412 $4443 $4513 $1963 $6281 $5562 $6979 $7998 $7776 $421 $1315 $641 $1496 $4095 $1987 54633 $2718 $3103 SIRO $125 $122 $4563 5467 $1800 $2156 $1822 53889 53092 $1698 $37.50 52513 $7330 $6410 A 1: Case background and site description You have been hired by the general manager (GM) of a budget hotel in Colorado. The hotel is part of a large economy lodging chain in North America. Economy lodging hotels include Super 8, Motel 6 and Days Inn. They are typically small, free-standing hotels with no food and beverage outlets (i.e., restaurants and bars), no conference or banquet facilities, no meeting spaces, and limited services. There is a single output: the provision of rooms for one or more nights. While there are "single" and "double rooms, differences are minor so there is no need to use weighted average prices or costs. With a single output, there is one obvious cost driver: the number of rooms rented. An economy lodging "property" typically has 110 rooms, although size may range from 60 to 175 rooms. Rooms are basic and there are few amenities. Room access is typically from the building's exterior. Like chain restaurants, economy lodging hotels develop standard properties to minimize construction costs. A typical property is staffed by a GM, five front desk workers, five housekeepers, a head housekeeper, a laundry worker, and a maintenance worker. Wages for all hotel workers other than the GM are at or slightly above the minimum wage; this is the result of high employee turnover and low-skill positions. Recruiting and training costs for employees, other than the GM, are minimal. The GM has a great deal of autonomy in running the day-to-day operations of the hotel. The GM is supervised by a district manager who typically oversees eight to fifteen properties, visiting each property every four to six weeks. GMs are responsible for pricing (with corporate oversight), local advertising, hiring and terminating hotel staff, selecting local suppliers for unique products or services leg., landscaping, snow removal and major repairs), purchasing and maintaining an inventory of standard products (e.g., soap, linens, coffee and cleaning supplies), and conducting sales calls with local businesses. GMs participate in the budgeting process, although the procedure varies somewhat depending on the district manager and the individual manager (i.e., some area managers prefer a top- down approach whereas others support a participative bottom-up approach). GMs are evaluated using both financial and non-financial metrics. A modest bonus is awarded to GMs who achieve their profit goals for the year. Additional bonuses are awarded for achieving customer satisfaction and internal audit targets. A property's financial targets for the bonus vary depending on local economic conditions and the physical condition of the assets. As with the budgeting process, the district manager may choose to negotiate the target with the GM or simply impose a target of her/his choosing. GMs who do not achieve a minimum, company-wide audit score (also the threshold for the bonus) for three years are to be terminated (despite this requirement, the chief financial officer could not remember this ever happening). The quality target is corporate-wide, but the specific figure depends on the property's age (i.e., newer or renovated properties are held to a higher target than older, more run-down properties). A 2: Estimating hotel's cost function Next week is the Area Manager's Meeting. Your GM wants to look good in front of her boss, the district managers and other general managers. To begin your analysis, you must estimate the hotel's cost equation. The accounting department provided you with three years (2015-2017) of monthly data (Appendix). These data consist of the following items: Item Rooms available Rooms rented Rooms revenues Other revenues Total revenues Front office Housekeeping Other personnel Total personnel Description A measure of capacity. Rooms out of service (for repairs] lower this measure. Number of rooms sold each month (i.e., sales volume] Total revenues received for rooms rented. Includes vending machines, Internet access, laundry, etc. The sum of room revenues and other revenues. Wages for the general manager and the front desk staff. Wages for housekeepers, housekeeper supervisor and laundry worker. Wages for the maintenance worker, payroll taxes, benefits, etc. The sum of front office, housekeeping and other personnel expenses. Expenses related to cleaning supplies, in-room amenities, coffee, etc. All expenses not otherwise classified (e.g., advertising) Expenses related to paint, plumbing supplies, electrical supplies, etc. Expenses for gas, electricity and water. Expenses for trash pickup, cable television, telephone equipment, etc. Supplies Other expenses Repairs Energy Other utilities A. 3 Cost Volume Profit January 2018. The GM has asked you to prepare a CVP analysis to aid in discussing next year's financial expectations at the upcoming Area Managers' Meeting. The meeting brings together 45 hotel managers and three district managers from the Southwest Region. We discussed that break-even sales volume is computed using fixed costs and the unit contribution margin. Since you will be forecasting break-even for this year (2018), you need to make several adjustments to the three years of historical data you obtained. These adjustments are described as follows: Price. You examine the average selling price (i.e., average daily rate) for the past two years and decide that the hotel's room rate for next year will continue the same trend; in other words, you will realize the same percentage increase for decrease) that was experienced in the past year. For example, if your rate increased 8% from 2016 to 2017, you will then forecast the 2018 room rate to be 8% above 2017's room rate. Costs. Your hotel's variable and fixed costs are obtained from the cost drivers. After consultation with industry experts, you predict fixed costs will be the same next year. Further, you expect the variable cost per room-night to increase 4% due to inflation. Based on your analysis of local market data, you believe that sales volumes will remain flat, that is, the number of rooms rented in 2018 will be unchanged from the 2017 sales volume. A.4 Budgeting January 2017. Your supervisor has asked you to prepare a 2018 operating budget. Analysis of historical data suggests the following monthly room demand: Months January and February March-May. September October June-August November and December Monthly Demand 5% of annual demand 8% of annual demand 12% of annual demand 7% of annual demand Revenues. The forecast the average daily rate and sales volume for 2018 is calculated for CVP. Assume the room rate is constant throughout the year. Costs. Assume now that you ran regressions for each of the separate expense categories. Increasing the variable cost estimates by 4% (a simplifying assumption) results in the cost formulas provided in the table below. Other cost categories are dropped to simplify the calculations Item Front desk Housekeeping Energy Supplies Cost Equation $7800 $4.30/rentalxRentals $1.35/rentalxRentals $4700 An alternative to regression is the industrial engineering method of cost estimation. Your regional manager provides you with the following insights: The front desk is staffed twenty-four hours per day. Average wages of front desk staff are $8.00/hour. Your annual salary, as general manager, is $27,000. Housekeeping should clean a room in 20 minutes. However, preparing the laundry cart and taking linens to the laundry room mean that, on average, only two rooms per hour can be cleaned. The hourly wage rate for housekeepers is expected be $7.50. A laundry worker works 20 hours per week at $7.50/hour. Room Amenities. Rooms are stocked with two bars of soap and a bottle of shampoo. Soap costs $0.14 a bar and shampoo costs $0.25 per bottle. At the beginning of each month, you want 25% of next month's requirements on hand. Beginning inventory requirements are met on January 1. Assume January 2018 room sales will be 900 rentals. Other Supplies. Paint, light bulbs, coffee, etc. average about $1000 per month. A.5 Financial performance The following table was obtained from your year-end income statement: Rooms Rented 15,713 Revenues $ 593,058 112,191 56,165 79,594 Controllable Costs Front Office Housekeeping Other Personnel Total Personnel Supplies Other Expense Repairs Energy Utilities Total Expense Controllable Profit 247,950 20,601 28,792 37,218 60,795 29,394 $ 424,750 $ 168,308 Mid-January 2019. To finish your presentation for next week's meeting, evaluate your performance. To do this, you obtained the following supplemental data from the company controller: Amount Item Allocated corporate expense Depreciation expense Interest expense Exceptional Items Average operating assets (total assets) Average current liabilities $ 93,528 $ 37,129 $ 1395 SO $408.244 $17,350 The firm's required rate of return is 8%, its weighted average cost of capital is 6%. Assume corporate income tax rate is 30% Capacity, Volume, Revenue and Personnel Data Repairs Energy Other Utilities Rooms Year Ma. Roons Available Rooms Revenue Other Revenue Total Revende Front Office House keeping Other Personnel Total Persoanel Supplies Other Expenses Rented $29,920 $29,777 $52,090 $51,618 $3530 $2979 $4781 $4461 $5978 $7070 $7014 $867 $2001 $2001 $1496 $652 $6411 $87,321 $101,024 $190 $365 $244 $450 $65 $869 $1996 SZOS 5834 $643 S556 $231 8341 5854 $336 $3823 $8253 $984 $3462 $7806 $4265 $9103 $10,321 39242 $9845 $6573 $7325 59201 $ 58823 $4997 $3119 $256 $2866 52140 $2711 $4062 53592 $1919 $2305 52730 $1296 $4930 2015! 3162 2015 2 2958 2015 3 3162 2015 4 3060 2015 5 3162 2015 6 3080 2015 7 3162 2015 8 2015 3060 2015 20 3162 2015 11 3060 2015 12 3162 2016 1 3162 2016 2 2016 3 3162 2016 4 3060 2016 5 3162 2016 6 3060 2016 7 3162 2016 8 3162 2016 9 3000 2016 10 3162 2016 11 3000 2016 12 3162 2017 1 3162 2017 2 2856 2017 3 3162 2017 1 3000 2017 5 3162 2017 3060 2017 7 3162 2017 8 3162 2017 9 3060 201T 10 3162 2017 11 3060 2017 12 3152 $1908 $6.20 $1456 $972 $1105 $1089 1017 823 1393 1421 1504 2040 1984 1761 1475 1271 1012 1141 .922 896 1189 1234 1546 1871 2265 2000 1542 1194 915 900 719 785 1367 1253 1644 2030 2572 2107 1722 1242 1096 1014 $40,100 $30,142 $52,43 $52,068 $64,043 $88,190 $100420 $81,672 $57,322 $47,397 $38,303 $38,147 534.767 $33,2 542,966 540,947 $58,429 575,457 $100,672 586,985 $05,129 549,133 $37.501 $38.024 $28. 225 $27.131 $7222 56772 $6076 $5%66 $4361 $3212 $3642 $3774 $3253 $4320 $4117 $5622 56982 $6900 58096 $S250 54624 $3461 $2009 $56,488 $46,754 $37.747 $28,376 $34,426 $32,728 542,630 $40,373 $58,119 $74,540 $99,560 $55,795 $04,104 348,663 $36,97 $27,519 $27,762 $26,742 $43,897 $39,692 $54,763 $78,221 $105.477 $86,730 $70,098 $48,32 342,596 $39,040 $9942 $9308 $11.306 59159 $7353 58714 $6368 $6632 $1871 $6536 $6162 $8614 $4150 $7380 $8249 $8832 $6675 $0878 34696 $7097 $4600 $1212 $1108 $2594 54525 $29009 520038 $1342 52116 $20,242 $17,220 $21,621 $19,907 $21,457 $21,808 $22,870 $21,327 $21.451 $20,554 $16,417 $18,008 $19,511 $15,03 $21.740 $16,762 $21,961 $24.499 $2,047 $21.929 $19,490 $18,003 $19,356 $16,423 $18,165 $14,804 $21,636 $17,177 $22,292 $22,252 $31,792 $25,015 $22,792 $211,510 $21,042 $19,99 53097 52158 $3004 52231 $6890 53062 $1425 51975 $1399 $923 55209 5720 $1993 $4676 $2561 $2095 54056 $2294 $2055 $4056 $3294 $558 55934 $10R3 $2637 57473 $5854 $4933 56389 $3107 $731 $6315 $874) $1421 57865 $7396 $2298 $4019 $3312 $711 52441 $3075 $1701 56408 $2401 $1322 55321 32 $1328 56659 ($3949) $2077 56017 $10,191 $4800 56311 $3523 $2833 54441 ($5875) $9053 $1222 $7241 $4390 59074 $3119 $350 55040 $2238 $7471 52352 S2313 $1010 $5415 $2378 $499 55523 52420 $1037 55662 $2464 $2145 $5121 $1914. $1191 57513 524801 $1836 584302395 $1401 $1641 52935 $2710 54649 $2046 $3501 50307 $2431 $135756864 $2870 $3271 99173 $2664 $1639 54094 $2931 $1732 54118 $2295 $952 55428 $2786 $4228 $1399 $1994 $820 5927 S1012 $1200 $1025 3370 $504 SSOS $463 $389 9772 S534 5862 S962 $1312 $1038 5710 566 S884 $501 $2918 $4774 $40.226 $55.625 $79,183 $106,789 $87,768 570,803 $49,401 $43.450 530.000 $8811 $9255 $7290 $9719 $7916 $9498 $9792 $12,624 $7830 $6382 $8153 $9259 $2006 $2710 $5601 $4290 $6513 $7898 $12.189 9187 S8634 $5412 $4443 $4513 $1963 $6281 $5562 $6979 $7998 $7776 $421 $1315 $641 $1496 $4095 $1987 54633 $2718 $3103 SIRO $125 $122 $4563 5467 $1800 $2156 $1822 53889 53092 $1698 $37.50 52513 $7330 $6410
Step by Step Solution
There are 3 Steps involved in it

Get step-by-step solutions from verified subject matter experts